All charts and tables below reflect data from the VAERS Database, including U.S. and foreign data, and is updated through: 5/21/2021.
| High-Level Summary | COVID19 vaccines (Dec’2020 – present) | All other vaccines 2010-present | All other vaccines 1990-present |
|---|---|---|---|
| Number of Adverse Reactions | 262,521 | 474,030 | 805,353 |
| Number of Life-Threatening Events | 4,590 | 6,317 | 13,154 |
| Number of Hospitalizations | 14,986 | 42,159 | 76,835 |
| Number of Deaths | 4,406* | 4,415* | 8,710 |
| # of Permanent Disabilities after vaccination | 3,299 | 9,435 | 18,534 |
| Number of Office Visits | 45,004 | 40,378 | 40,700 |
| # of Emergency Room/Department Visits | 34,435 | 84,917 | 208,104 |
| # of Birth Defects after vaccination | 142 | 117 | 121 |
Deaths


Chart using comparable 6 month periods, since Covid-19 vaccines have only been available for approximately 6 months:


Adverse Events

Chart using comparable 6 month periods, since Covid-19 vaccines have only been available for approximately 6 months:

Symptoms
The slide below was taken from an FDA document from October 22, 2020 and provides a list of possible adverse event outcomes related to the Covid-19 vaccines.
- Source: ‘Vaccines and Related Biological Products Advisory Committee October 22,2020 Meeting Presentation”.
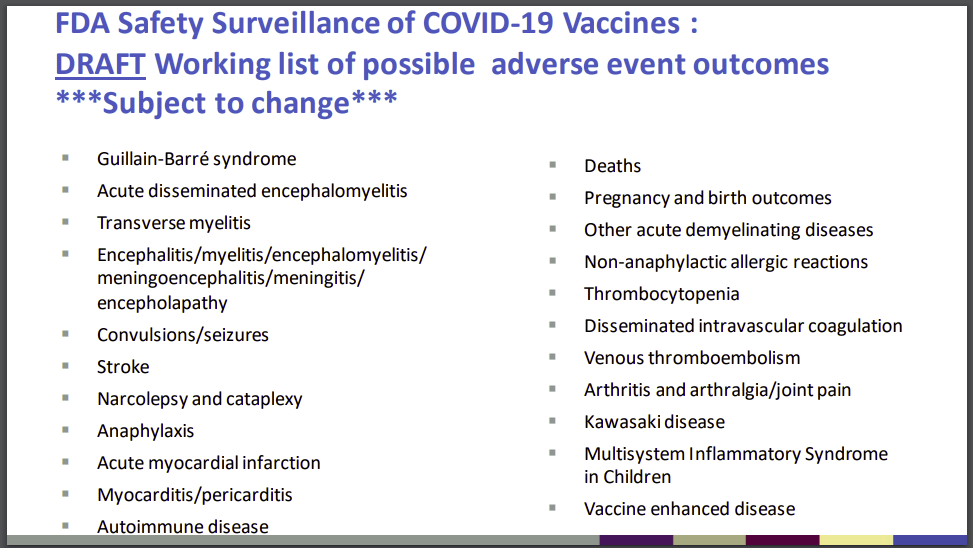
The following table lists the number of adverse events found in the VAERS data which match the outcomes listed above:
| FDA Listed Symptom | Total (Non-Lethal) Adverse Events | Total Deaths |
|---|---|---|
| Guillain-Barre | 237 | 4 |
| Acute Disseminated Encephalomyelitis | 15 | 1 |
| Transverse Myelitis | 83 | 0 |
| Encephalitis | 243 | 30 |
| Convulsions/Seizures | 2480 | 66 |
| Stroke | 2355 | 172 |
| Narcolepsy, Cataplexy | 30 | 0 |
| Anaphylaxis | 13190 | 29 |
| Acute Myocardial Infarction (Heart Attack) | 545 | 197 |
| Myocarditis/Pericarditis | 422 | 2 |
| Autoimmune Disease | 128 | 5 |
| Other Acute Demyelinating Diseases | 31 | 1 |
| Pregnancy and birth outcomes (Miscarriages) | 523 | 4 |
| Other Allergic Reactions | 309 | 0 |
| Thrombocytopenia | 434 | 40 |
| Disseminated Intravascular Coagulation | 19 | 11 |
| Venous Thromboembolism | 2793 | 162 |
| Arthritis and Arthralgia/Joint Pain | 16761 | 34 |
| Kawasaki Disease | 6 | 0 |
| Systemic Inflammatory Response Syndrome | 100 | 5 |
Vaccination Related Risks of COVID19 Vs. Flu
These set of figures compare the COVID19 vaccine to the traditional Flu vaccines. ‘Risk of Death’ percentages depend on the ‘# of Vaccinations’ data, which is only approximate, and was pulled from the CDC’s report on Flu vaccination coverage for the 2019-2020 season, and from Our World in Data for the COVID19 vaccinations.
Covid19 vaccinations through 5/21/2021 vs. Flu vaccinations 7/1/2019 – 5/31/2020 (last complete flu season)
| Vaccine Type | # of Vaccinations | # of Deaths | Risk of Death | Percentage |
|---|---|---|---|---|
| Flu | 167,447,642[1] | 91 | 1 in 1,840,083 | 0.000054% |
| COVID19 | 161,278,336[2] | 4,406 | 1 in 36,604 | 0.002732% |
| Vaccine Type | # of Vaccinations | # of Adverse Reactions | Risk of Adverse Reaction | Percentage |
|---|---|---|---|---|
| Flu | 167,447,642 | 10,426 | 1 in 16,061 | 0.006226% |
| COVID19 | 161,278,336 | 262,521 | 1 in 614 | 0.1628% |
[1] number of flu vaccinations based on estimated flu vaccine coverage data from CDC and estimated population data from US Census. Yearly flu vaccination data covers a period of time from 7/1 to 5/31 of the following year.
[2] number of covid19 vaccinations based on estimates from Our World in Data

Vaccine Data by Manufacturer
| Manufacturer | # of Deaths | % Deaths | Average Deaths/Day | Days since EUA approval | EUA Approval Date- |
|---|---|---|---|---|---|
| Janssen (JNJ) | 345 | 7.83% | 4.11 | 84 | 2/26/2021 |
| Moderna | 2077 | 47.13% | 13.49 | 154 | 12/18/2020 |
| Pfizer/Biontech | 1963 | 44.54% | 12.19 | 161 | 12/11/2020 |
| Unknown | 22 | 0.5% |
| Manufacturer | # of Adverse Events | % AEs | Average AEs/Day | Days since EUA approval | EUA Approval Date |
|---|---|---|---|---|---|
| Janssen (JNJ) | 35055 | 13.34% | 417.32 | 84 | 2/26/2021 |
| Moderna | 122712 | 46.71% | 796.83 | 154 | 12/11/2020 |
| Pfizer/Biontech | 104087 | 39.62% | 646.5 | 161 | 12/18/2020 |
| Unknown | 852 | 0.32% |
Hi Wayne,
This is a great website and very informative. I was hoping to find a site or someone that could validate my accusations about covid vaers being throttled or at the very least grossly behind in publishing reports to the public domain? I have been saying when the AE’s are calibrated to the vaccination date, we can see that the majority (59%) of all reported AE’s are from jabs in February or older (as of data drop 5/28). I was hoping you may consider taking a look yourself and publishing your findings. It is very disingenuous of CDC/FDA/VAERS that the are so far behind at the current time. I’m starting to realize the pattern is intentional and they are simply throttling the data and may never bring the true statistics current.
Sincerely,
WelcomeTheEagle88
Hi Alberto,
Thanks! Yes, I am very interested in validating the idea that the VAERS data is being throttled/backlogged. It has become fairly apparent to me as well, from following the data on a weekly basis, that the data is not being published in its entirety, or that there is some backlog. However, I have not yet examined the data specifically for this idea to be able to come to a firm conclusion. I hope to be able to do this type of analysis soon, along with something else I am very interested in, which is to document how many records are being erased each week from their system.
btw in case you are interested, Tim Truth is the creator of http://www.vaxpain.us and the Arkivist @the_Arkivist on Twitter, is the creator of http://www.openvaers.com
-WTE88