We will now attempt to show using the CDC’s WONDER Search tool, how to verify the numbers for the Covid-19 deaths in the chart below. It is important to remember that for the chart below, the date that is assigned to each VAERS record is going to be based on the first non-empty value found from the following fields, going in sequential order: (1) DATEDIED, (2) VAX_DATE, (3) ONSET_DATE, (4) RECVDATE.

To start off, we will submit the Request Form with the following parameters:
- Section 1. Organize table layout: –> Group Results By: choose “Year Died”
- Section 3. Select vaccine characteristics: –>Vaccine Products: choose “COVID19”
- Section 4. Select location, age, gender: –> State / Territory: choose “All Locations”
- Section 5: Select other event characteristics: –> Event Category: choose “Death”
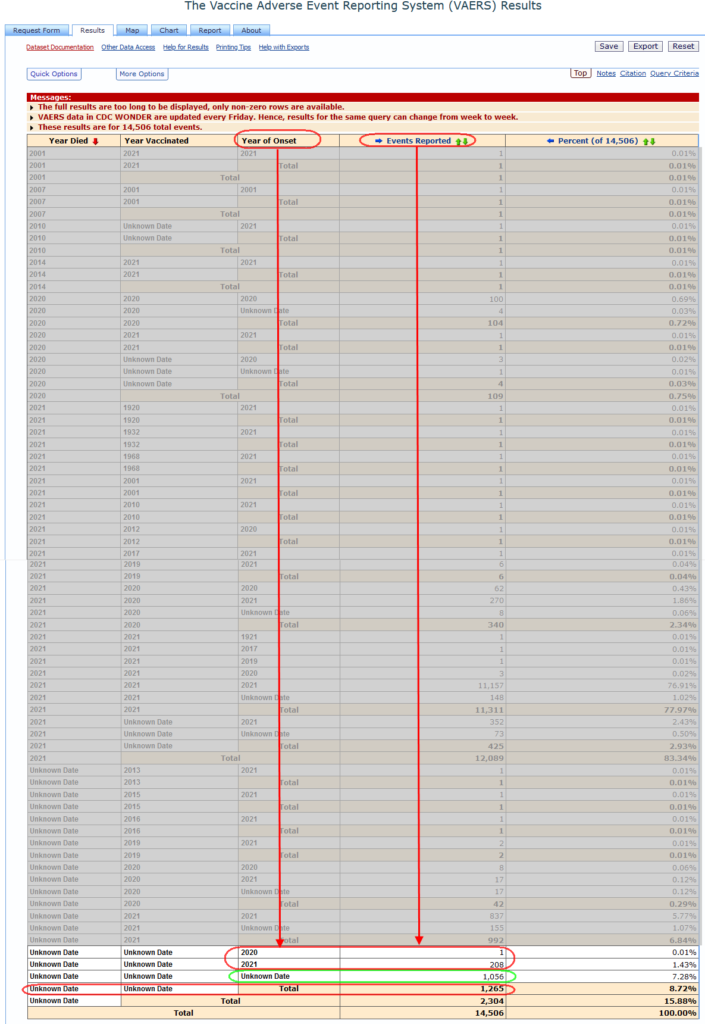
Upon submitting the form, this is what you should see:

First, you will note that there are 14,506 deaths (first red circle above), which matches our number from the High-Level Summary from Part 1 for the Total Deaths from Covid-19 jabs. Second, what we are seeing here is the count of deaths in the second column (Events Reported) which were found where the DATEDIED field fell into the year listed in the first column (Year Died). So in this case, 1 death record was found with a DATEDIED in 2001, 1 death record was found with a DATEDIED in 2007, 1 in 2010, 1 in 2014, 109 in 2020, and 12089 in 2021. Obviously, since these are Covid-19 jab records, any death records found in years previous to 2020 are not actually correct dates. We do however see that most records fall into the years 2020 and 2021 (109 and 12089 records respectively).
Now comes the important part– the number of records in the “Unknown Date” category (circled above in green) is 2304. This represents the number of records for which the DATEDIED field was empty. What we need to do now is to move to the next date in our sequence, which is the VAX_DATE. What we will do is go back to the Request Form, and add an extra Group Results By parameter to Section 1. Organize table layout:. We will add the “Year Vaccinated” (VAX_DATE) as the 2nd parameter, like below:

Upon submitting the form, you will see the screen below. Now in order to make it less confusing, the parts you don’t need to focus on are grayed out, and we will be looking at the area at the bottom of the chart.

First take notice of the 2nd row from the very bottom of the chart. This is the 2304 number again, which represents all the death records which were empty (or “Unknown”) in the DATEDIED field. Then notice that the third column (Events Reported) represents the number of deaths found where the VAX_DATE field fell into the year listed in the second column (Year Vaccinated). So we have 1 death for 2013, 1 death for 2015, 1 death for 2016, 2 deaths for 2019, 42 deaths for 2020, and 992 deaths for 2021, all based on the VAX_DATE. Then observe, once again that we have a number of records (circled in green), 1265, which are classified as “Unknown Date”. These are the records for which the VAX_DATE field was empty (as was the DATEDIED field previously).
Again, what we need to do now is to move to the next date in our sequence, which is the ONSET_DATE. We then need to go back the Request Form, and this time add a third Group Results By parameter to Section 1. Organize table layout:. This time we will add the “Year of Onset” (ONSET_DATE) as the 3rd parameter, like below:

Upon submitting the form, you will see the screen below. Once again, the parts you don’t need to focus on are grayed out, and we will be looking at the area at the bottom of the chart.
The 3rd row from the very bottom of the chart has the 1265 number again. This is the number of death records which were empty (or “Unknown”) in the VAX_DATE field. The third column (Events Reported) represents the number of deaths found where the ONSET_DATE field fell into the year listed in the second column (Year of Onset). So we have 1 death for 2020, and 208 deaths for 2021, all based on the ONSET_DATE. Then observe, once again that we have a number of records (circled in green), 1056, which are classified as “Unknown Date”. These are the records for which the ONSET_DATE field was empty.
For the final time, we will move to the next and last date in our sequence, which is the RECVDATE. We then need to go back the Request Form, and this time add a fourth Group Results By parameter to Section 1. Organize table layout:. This time we will add the “Year Received” (RECVDATE) as the 4th parameter, like below:

Submit the form and you will see the screen below. Once again, the parts you don’t need to focus on are grayed out, and we will be looking at the area at the bottom of the chart.
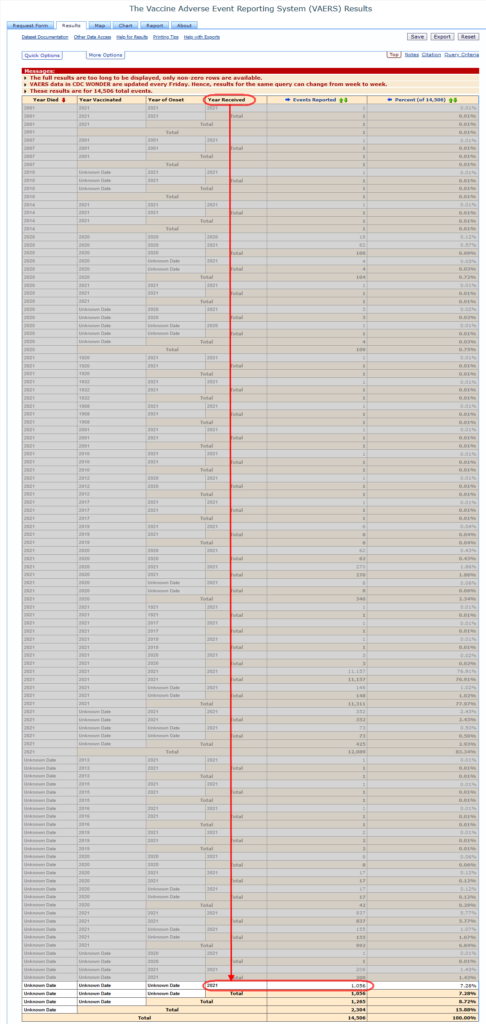
Remember that every VAERS record has a RECVDATE. The circled area above shows that the remaining 1056 death records, for which there was previously not found an ONSET_DATE (nor a VAX_DATE, nor a DATEDIED), are now found to be in year 2021 based on the RECVDATE.
Congratulations if you have gotten this far and are not confused! We will now wrap things up by taking the numbers we have found from the CDC’s WONDER Search tool, and match them up to the numbers on our “Reported Deaths By Year, COVID-19 Vaccines vs. All Other Vaccines” chart.
Using the CDC’s Search tool, we initially grouped the death records by the DATEDIED field, finding the following death counts by year:
| YEAR | DEATHS BASED ON DATEDIED |
| 2001 | 1 |
| 2007 | 1 |
| 2010 | 1 |
| 2014 | 1 |
| 2020 | 109 |
| 2021 | 12089 |
Next we grouped these 2304 remaining “UNKNOWN” deaths by the VAX_DATE field, and found the following death counts by year:
| YEAR | DEATHS BASED ON VAX_DATE |
| 2013 | 1 |
| 2015 | 1 |
| 2016 | 1 |
| 2019 | 2 |
| 2020 | 42 |
| 2021 | 992 |
Next we grouped these 1265 remaining “UNKNOWN” deaths by the ONSET_DATE field, and found the following death counts by year:
| YEAR | DEATHS BASED ON ONSET_DATE |
| 2020 | 1 |
| 2021 | 208 |
Lastly, we grouped these remaining 1056 “UNKNOWN” deaths by the RECVDATE field, and found the following death counts by year:
| YEAR | DEATHS BASED ON RECVDATE |
| 2021 | 1056 |
If we now combine all these results we get the following:
| YEAR | COVID-19 DEATHS |
| 2001 | 1 |
| 2007 | 1 |
| 2010 | 1 |
| 2013 | 1 |
| 2014 | 1 |
| 2015 | 1 |
| 2016 | 1 |
| 2019 | 2 |
| 2020 | 109+42+1 = 152 |
| 2021 | 12089+992+208+1056 = 14345 |
Do you notice how these numbers, which we retrieved from the official CDC VAERS website (albeit in a roundabout way), match exactly the blue numbers in the chart below?