So we’ve established that the High-Level Summary numbers are easy to verify against the official VAERS website. But what about the numbers on the charts you see plastered all over this website? Can we reproduce all of those numbers using the official VAERS website? The simple answer is NO. As explained before in part 1 in a caveat, this is primarily due to the fact that there are many missing dates in the VAERS system, which ends up requiring us to make a decision on how to handle assigning dates to any given VAERS record. There is probably no “right” answer as to how to handle the problem of missing dates, but the approach taken by this website I believe to be reasonable and logical. First, let’s see what the statistics are on exactly how often dates are missing:
| Data as of 9/10/21 release (data updated through 9/3/21) | COVID19 | % | All other vaccines | % |
| # of Death Records | 14506 | 8993 | ||
| # of All Adverse Events | 675593 | 819638 | ||
| # of Death Records without a DATEDIED | 2304 | 15.88308286 | 3083 | 34.2822195 |
| # of Records without a VAX_DATE | 47303 | 7.001700728 | 118983 | 14.51653047 |
| # of Records without a ONSET_DATE | 49157 | 7.276126307 | 166364 | 20.29725318 |
| # of Records without a RECVDATE | 0 | 0 | 0 | 0 |
| # of Records without a RPT_DATE | 675169 | 99.93724032 | 215531 | 26.29587696 |
| # of Records without a TODAYS_DATE | 2668 | 0.394912321 | 636248 | 77.62548833 |
| # of Records where TODAYS_DATE = RECVDATE | 447539 | 66.2438776 |
As you can see from the chart above, the date fields for the Covid-19 records are actually more fully populated in comparison to the historical non-Covid-19 records. For example, a full 34% of death records for non-Covid vaccines do not have a DATEDIED date, whereas for the Covid-19 records, it is only about 16%. Notice also that the RPT_DATE is likely a deprecated field that is no longer used, since 99.9% of Covid-19 records do not have this field populated, whereas most of the older non-Covid-19 records did have this field populated (regardless, the RPT_DATE field was not considered and not used in the charts and analysis posted on this website).
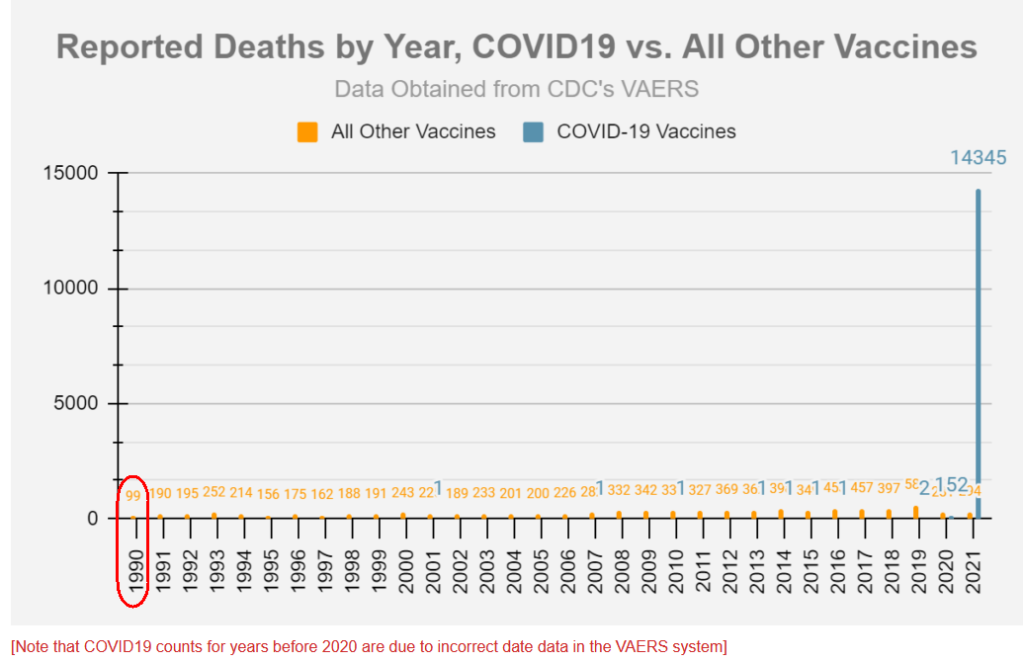
It will be easier to illustrate the challenges we face when trying to summarize data by date by looking at an example. We will look at the current “Deaths By Year, Covid19 vs. All Other Vaccines” chart:
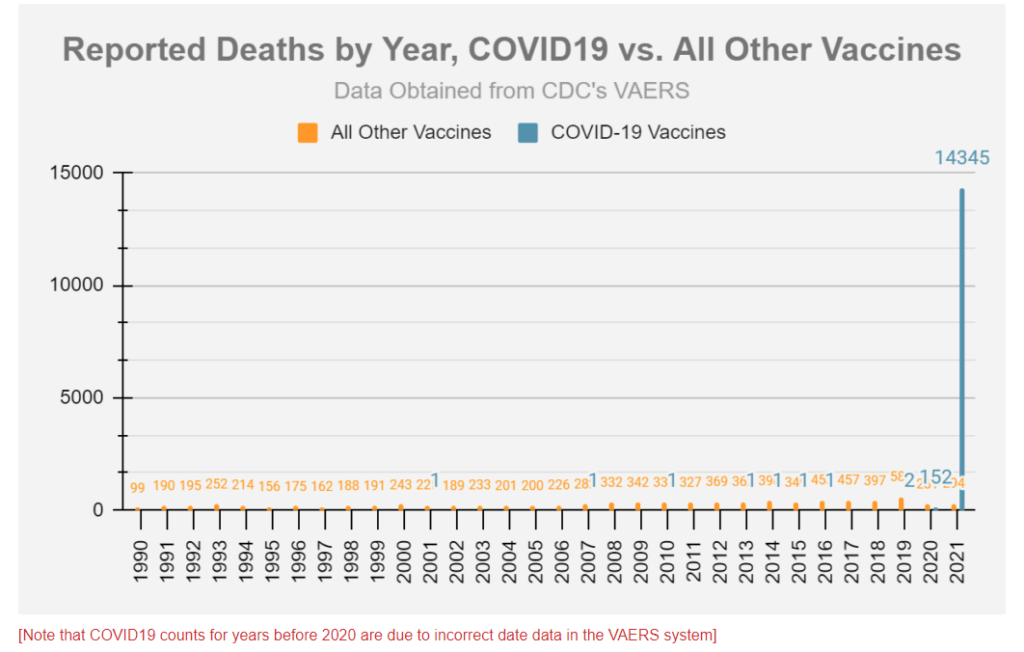
First a reminder from Part 1 about how dates are being assigned for our chart. First we get all the VAERS death records where DIED=’Y’. Then we assign a date to each record based on the first non-empty date value that we find in the following fields in sequential order: DATEDIED, VAX_DATE, ONSET_DATE, RECVDATE. So for example, if a VAERS record has no DATEDIED value, and has no VAX_DATE value, but has an ONSET_DATE value, then we consider that VAERS record’s ONSET_DATE to be the assigned date we will use. Since every VAERS record at a bare minimum has a RECVDATE, even if none of the other dates are populated, there will always be a date assigned to each record.
We will look at the year 1990 for the non-Covid-19 vaccines. The number on the chart is 99 deaths for that year. Is it possible to reproduce this number using the official VAERS website? Let’s find out.
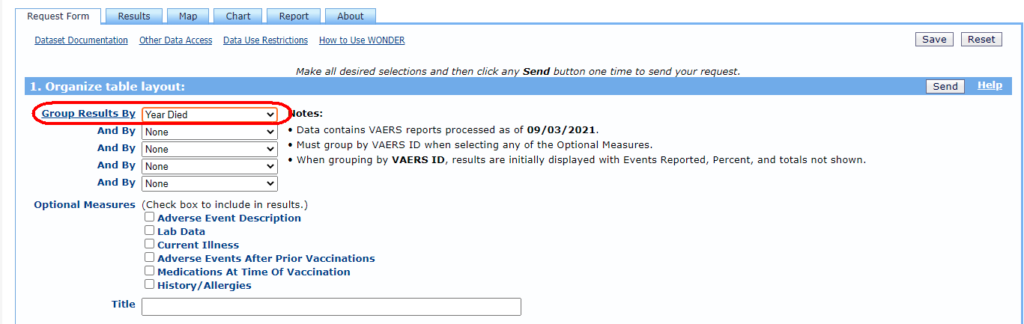
Using the official VAERS website’s Request Form (https://wonder.cdc.gov/vaers.html), first in Section 1., we will Group Results By the “Year Died”:
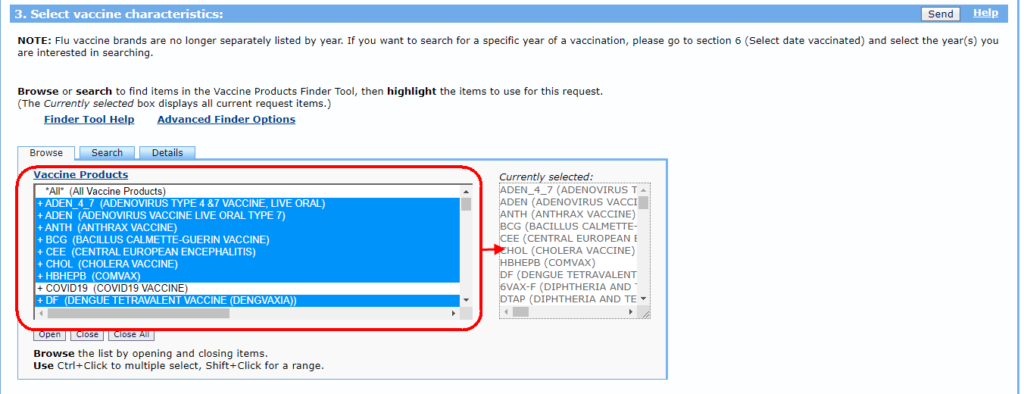
Then we go to section 3. and Choose all the Vaccine Products except for COVID19 (and obviously, *All*):
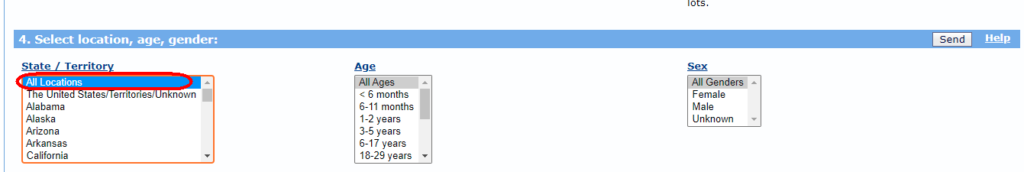
Next we choose “All Locations” for State / Territory in Section 4.:
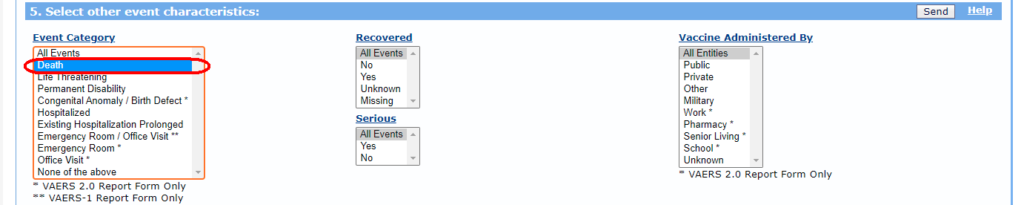
Then choose “Death” for the Event Category for Section 5.:
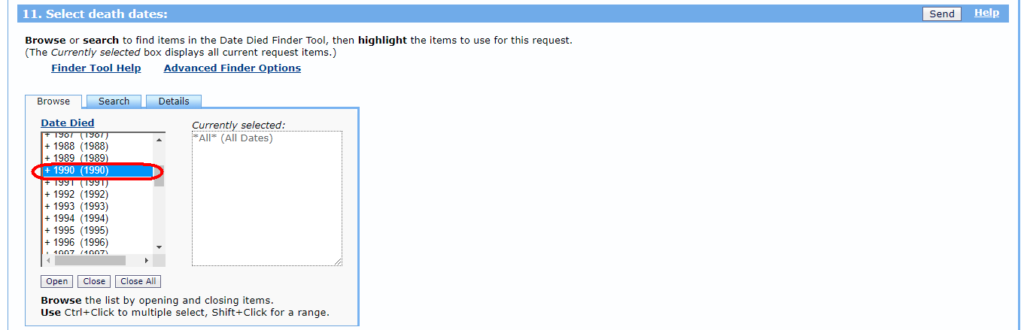
Now comes the tricky part. We can see that Sections 7 through 11 give you the option for selecting specific years for the various date fields (RPT_DATE, RECVDATE, VAX_DATE, ONSET_DATE, DATEDIED). Which do you choose? One of them? Some of them? All of them? Let’s start by using just one: we will select 1990 for the DATEDIED (Section 11.):
Press any “Send” button and you should get the following:
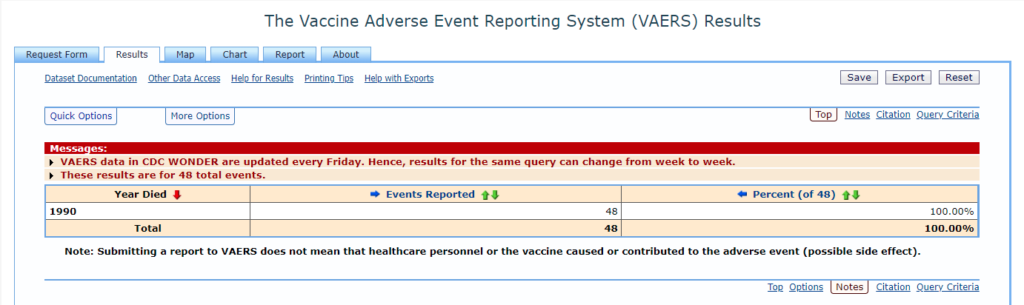
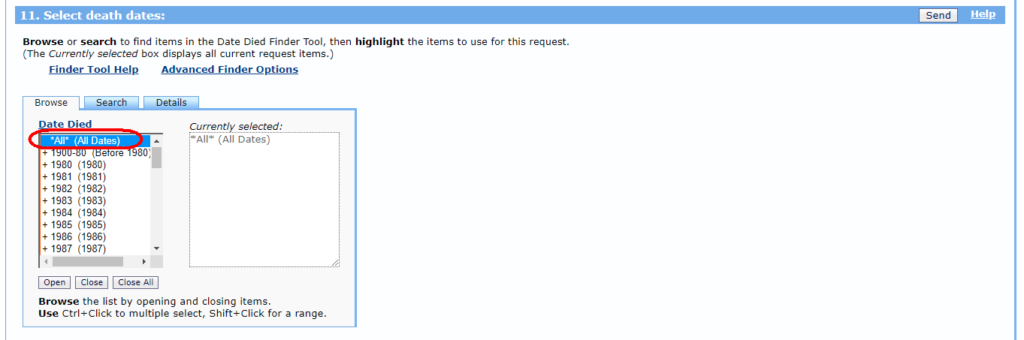
Not quite matching our 99 number is it? Let’s go back to the request form, change the DATEDIED (Section 11.) back to “All” and instead put 1990 in the RECVDATE (Section 8.) instead:
Once again, press any “Send” button and you should get the following:
Press “Send”, what do you get?:

So as you can see, we get 36 records, which is even fewer than before. So why is this? It is because as you add more selected date parameters, you are requiring each record returned to meet every one of those conditions…In other words, each of the 36 records returned in our search must have had a date in 1990 for each of the following date fields: DATEDIED, VAX_DATE, ONSET_DATE, RECVDATE. So you could call this approach to filtering a progressively “restrictive” or “limiting” approach.
Contrast that with the filtering approach taken by this website, which you could deem an “inclusive” approach. This approach allows more records to be returned, because a record that is missing a DATEDIED value could still be included if the VAX_DATE is in 1990. Or even if the VAX_DATE is empty, but the ONSET_DATE is in 1990. Or even if all three previous date fields are blank, but the RECVDATE is in 1990. And this is how our chart can have 99 records for 1990 and still be completely accurate.
In conclusion, is it always possible to simplistically replicate the exact same numbers on our charts (that classify data by date) using just the VAERS website search tool? NO. However, in Part 2(B), below, we will show how those numbers actually can in fact be replicated and verified, albeit in a very labor-intensive way.
PART 2(B):
The only way to truly verify the non-Covid vaccine yearly numbers on the “Deaths By Year, Covid19 vs. All Other Vaccines” chart is to pull the actual records from VAERS so you can examine each of the four date fields for each record. We will now do that and we will continue using the year 1990. We will be pulling data from the official VAERS website search tool 4 separate times, as follows:
| Data Pull For: | Parameters | # Records Found |
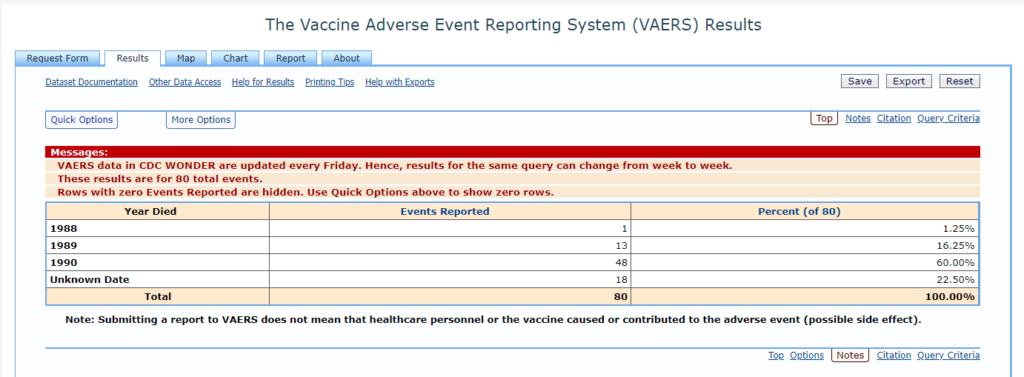
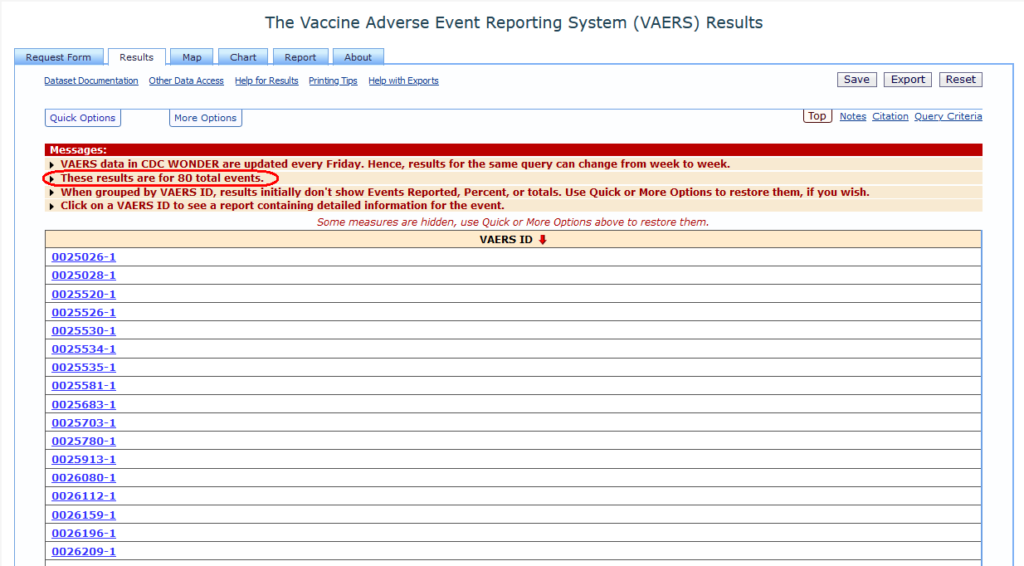
| DATEDIED | 1. Organize table layout: Group Results By: “VAERS ID” 3. Select vaccine characteristics: Vaccine Products: Choose all except for “COVID19” 4. Select location, age, gender: State / Territory: Choose “All Locations” 5. Select other event characteristics: Event Category: Choose “Death” 11. Select death dates: Date Died: Choose “1990” | 80 |
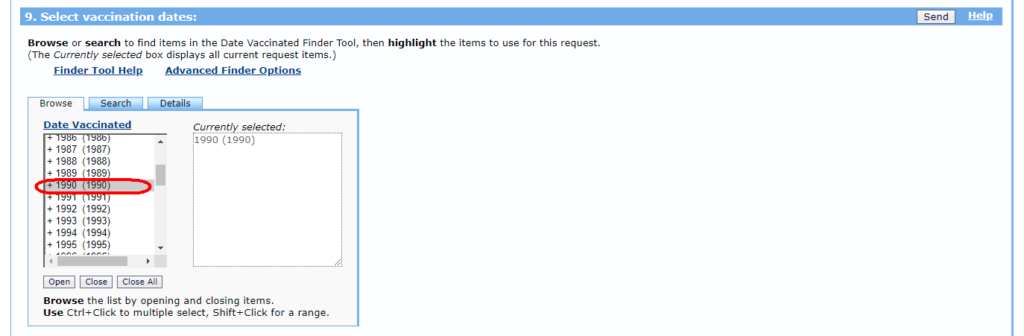
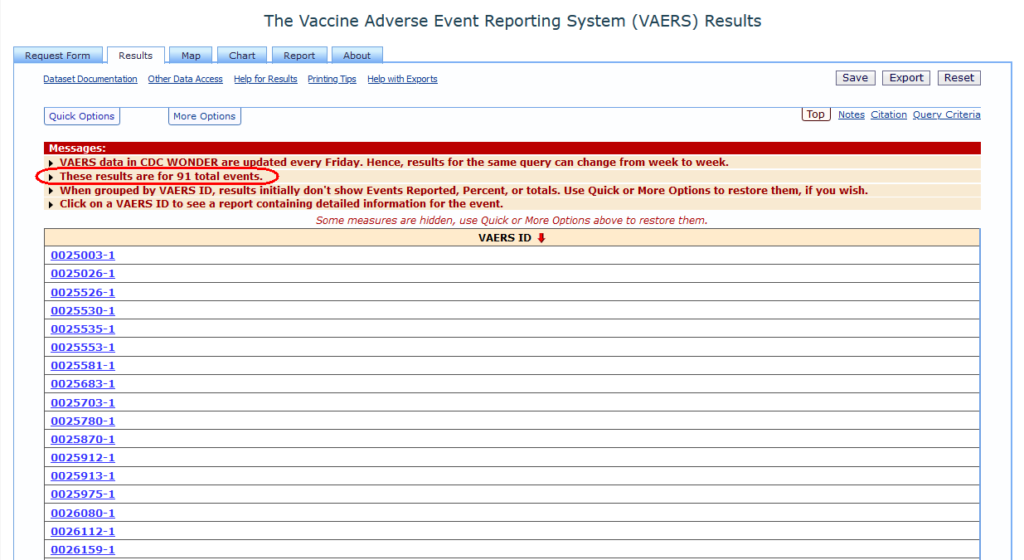
| VAX_DATE | 1. Organize table layout: Group Results By: “VAERS ID” 3. Select vaccine characteristics: Vaccine Products: Choose all except for “COVID19” 4. Select location, age, gender: State / Territory: Choose “All Locations” 5. Select other event characteristics: Event Category: Choose “Death” 9. Select vaccination dates: Date Vaccinated: Choose “1990” | 91 |
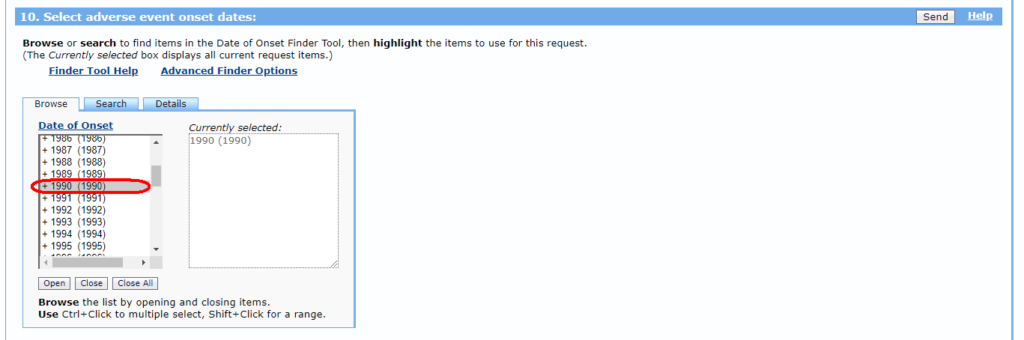
| ONSET_DATE | 1. Organize table layout: Group Results By: “VAERS ID” 3. Select vaccine characteristics: Vaccine Products: Choose all except for “COVID19” 4. Select location, age, gender: State / Territory: Choose “All Locations” 5. Select other event characteristics: Event Category: Choose “Death” 10. Select adverse event onset dates: Date of Onset: Choose “1990” | 89 |
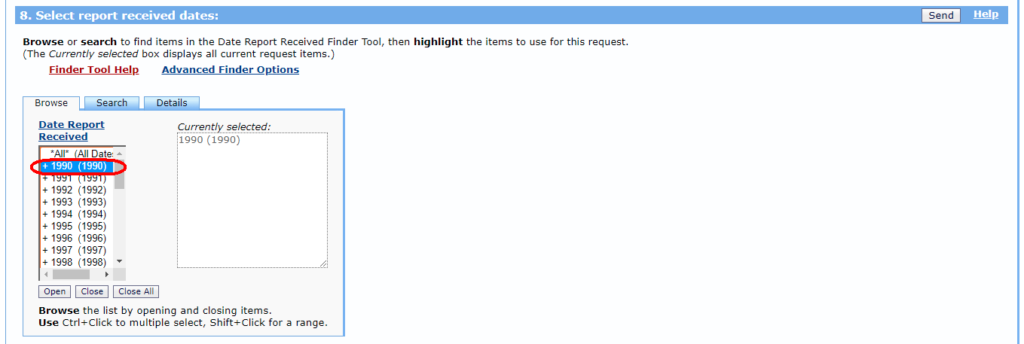
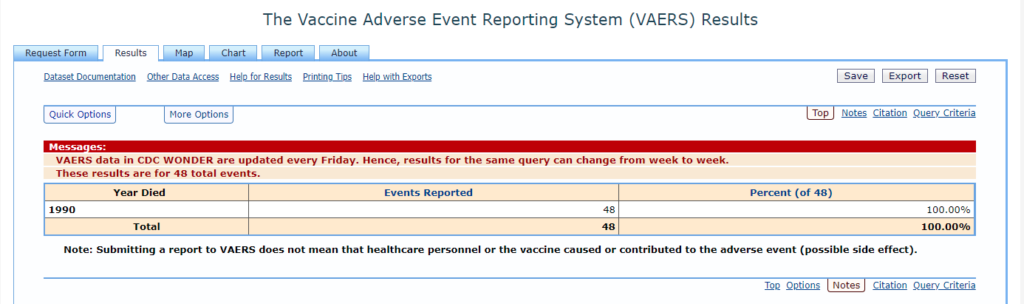
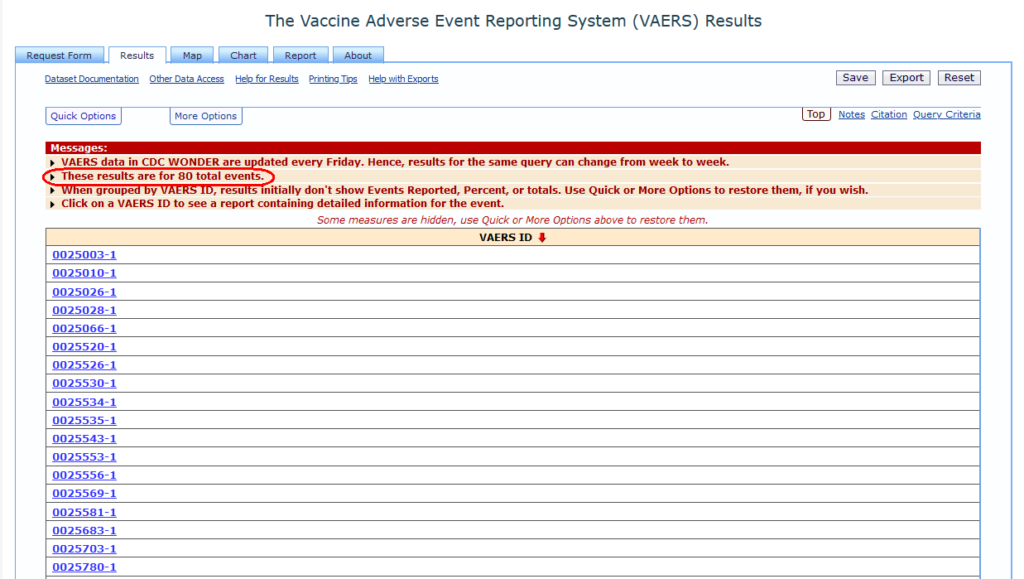
| RECVDATE | 1. Organize table layout: Group Results By: “VAERS ID” 3. Select vaccine characteristics: Vaccine Products: Choose all except for “COVID19” 4. Select location, age, gender: State / Territory: Choose “All Locations” 5. Select other event characteristics: Event Category: Choose “Death” 8. Select report received dates: Date Report Received: Choose “1990” | 80 |
For the “Year Died” (DATEDIED) result set, we essentially told VAERS to give us all the non-COVID19 death records where the DATEDIED field was in the year 1990. You should see the following:
For the “Year Vaccinated” (VAX_DATE) result set, we essentially told VAERS to give us all the non-COVID19 death records where the VAX_DATE field was in the year 1990. You should see the following:
For the “Year of Onset” (ONSET_DATE) result set , we essentially told VAERS to give us all the non-COVID19 death records where the ONSET_DATE field was in the year 1990. You should see the following:

For the “Year Received” (RECVDATE) result, we essentially told VAERS to give us all the non-COVID19 death records where the RECVDATE field was in the year 1990. You should see the following:
So how do you get from the result sets above (DATEDIED – 80, VAX_DATE – 91, ONSET_DATE – 89, RECVDATE – 80) to the 99 represented in our original chart? Well, if we are limited to just using the VAERS search tool and these result sets, you would have to essentially combine the 4 result sets and then look at the dates for each record.
Embedded below is an excel file in which the first 4 sheets contain the data from each of our four result sets.
Each of these sheets displays not only the VAERS_ID, but also the actual DATEDIED, VAX_DATE, ONSET_DATE, and RECVDATE values for each record found. Also, the 2nd column in each sheet is hyperlinked so that you can go directly to the record in a new browser window (courtesy www.medalerts.org) to verify that the date data is actually correct for each record. So if we look at the first sheet (“Results by DATEDIED”), you will see that the DATEDIED column is in red, to indicate that the data pulled from VAERS for this dataset was restricted to records for which the DATEDIED field is in 1990. The other three sheets follow the same format, but for the other three respective date fields (VAX_DATE, ONSET_DATE, RECVDATE). The fifth sheet, labeled “COMBINED”, is where things get interesting: this one is a combination of the data from the four datasets. You will see that there are 126 records, which represents all the unique VAERS records which are found amongst the four datasets (obviously, this means that there were many records which showed up in more than one dataset). We now apply the previously mentioned rule regarding interpretation of dates which are in place for this website (again with the disclaimer that there is not necessarily only one “right” rule for this). Remember that the rule is this: For every record, we assign to it the first non-empty date value found when looking at the four date fields in this sequential order: DATEDIED, VAX_DATE, ONSET_DATE, RECVDATE. Using this rule, we can now go through our list of 126 records and assign a year, which has already been done in the “Year Assigned?” column. Then we eliminate any record that was not assigned a date in 1990; you will see that such records have been crossed off and grayed out. In totality, you should see that 27 records have been eliminated, leaving exactly 99 records which are actually classified as 1990 records for the purposes of our “Deaths By Year, Covid19 vs. All Other Vaccines” chart. The last sheet in our excel file, labeled “FINAL”, shows these 99 records and color codes them to clearly show that 80 records qualified as 1990 records based on the DATEDIED field (these are highlighted in yellow), 16 records qualified based on the VAX_DATE field (highlighted in orange), 1 record qualified based on the ONSET_DATE field (highlighted in green), and 2 records qualified based on the RECVDATE field (highlighted in blue).
Hopefully that all made sense to you…
In Part 3 we will use this same chart again, but look at the Covid-19 death numbers.