All charts and tables below reflect the data release on 11/18/2022 from the VAERS website, which includes U.S. and foreign data, and is updated through: 11/11/2022
| High-Level Summary | COVID19 vaccines (Dec’2020 – present) | All other vaccines 1990-present | US Data Only COVID19 vaccines (Dec’2020 – present) | US Data Only All other vaccines 1990-present |
|---|---|---|---|---|
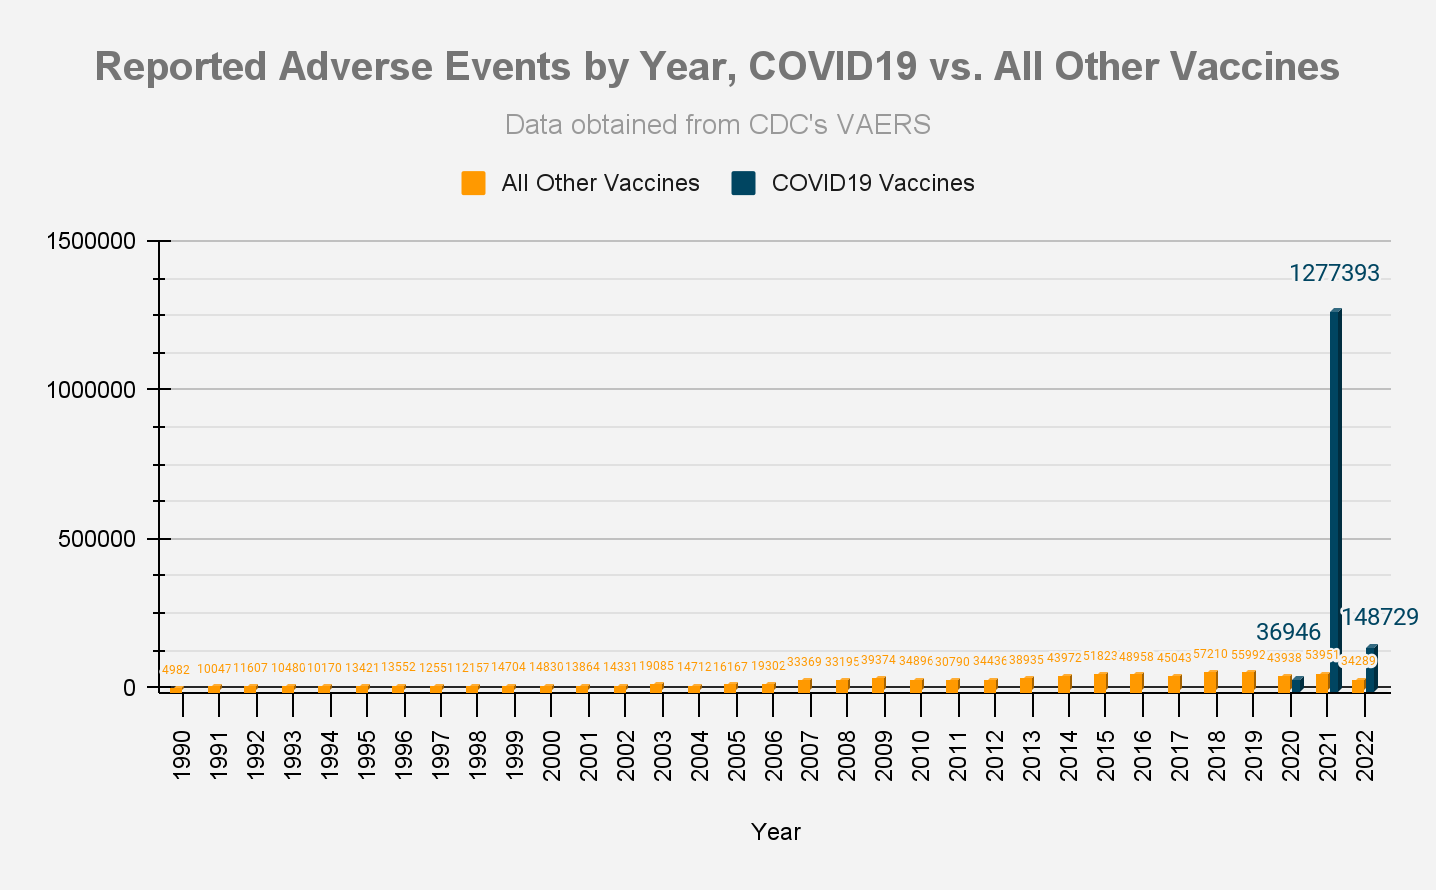
| Number of Adverse Reactions | 1,463,068 | 908,254 | 898,029 | 789,574 |
| Number of Life-Threatening Events | 34,942 | 14,794 | 13,487 | 10,112 |
| Number of Hospitalizations | 183,615 | 85,957 | 71,617 | 39,880 |
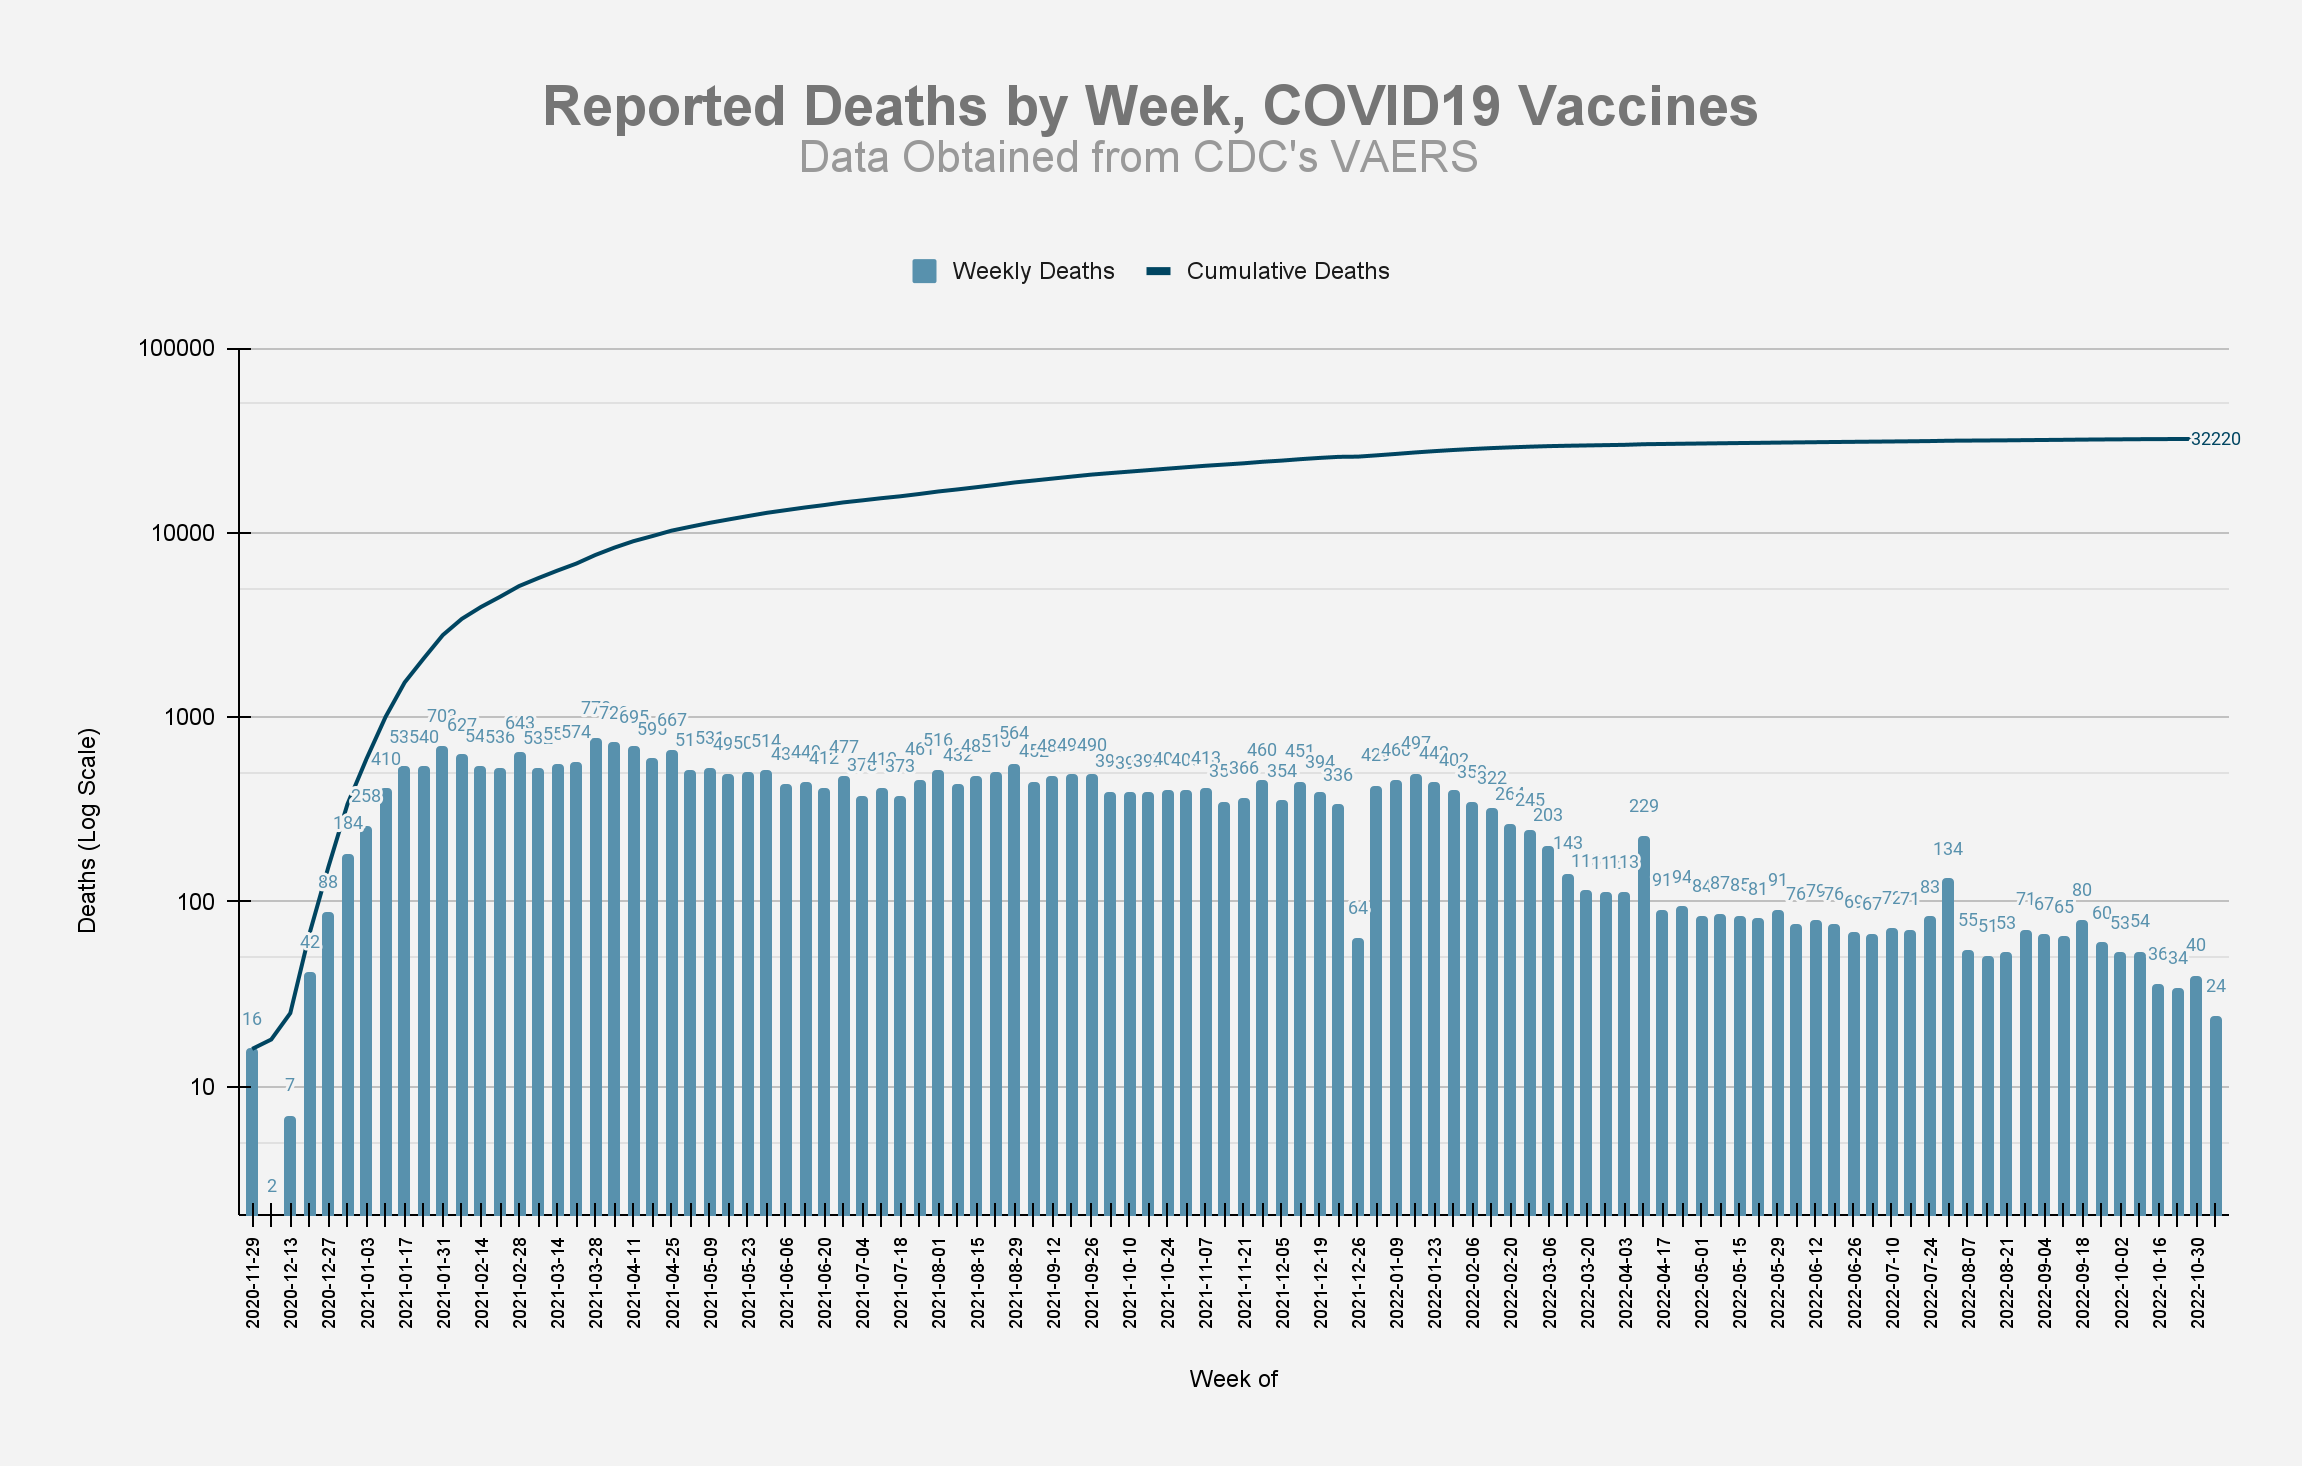
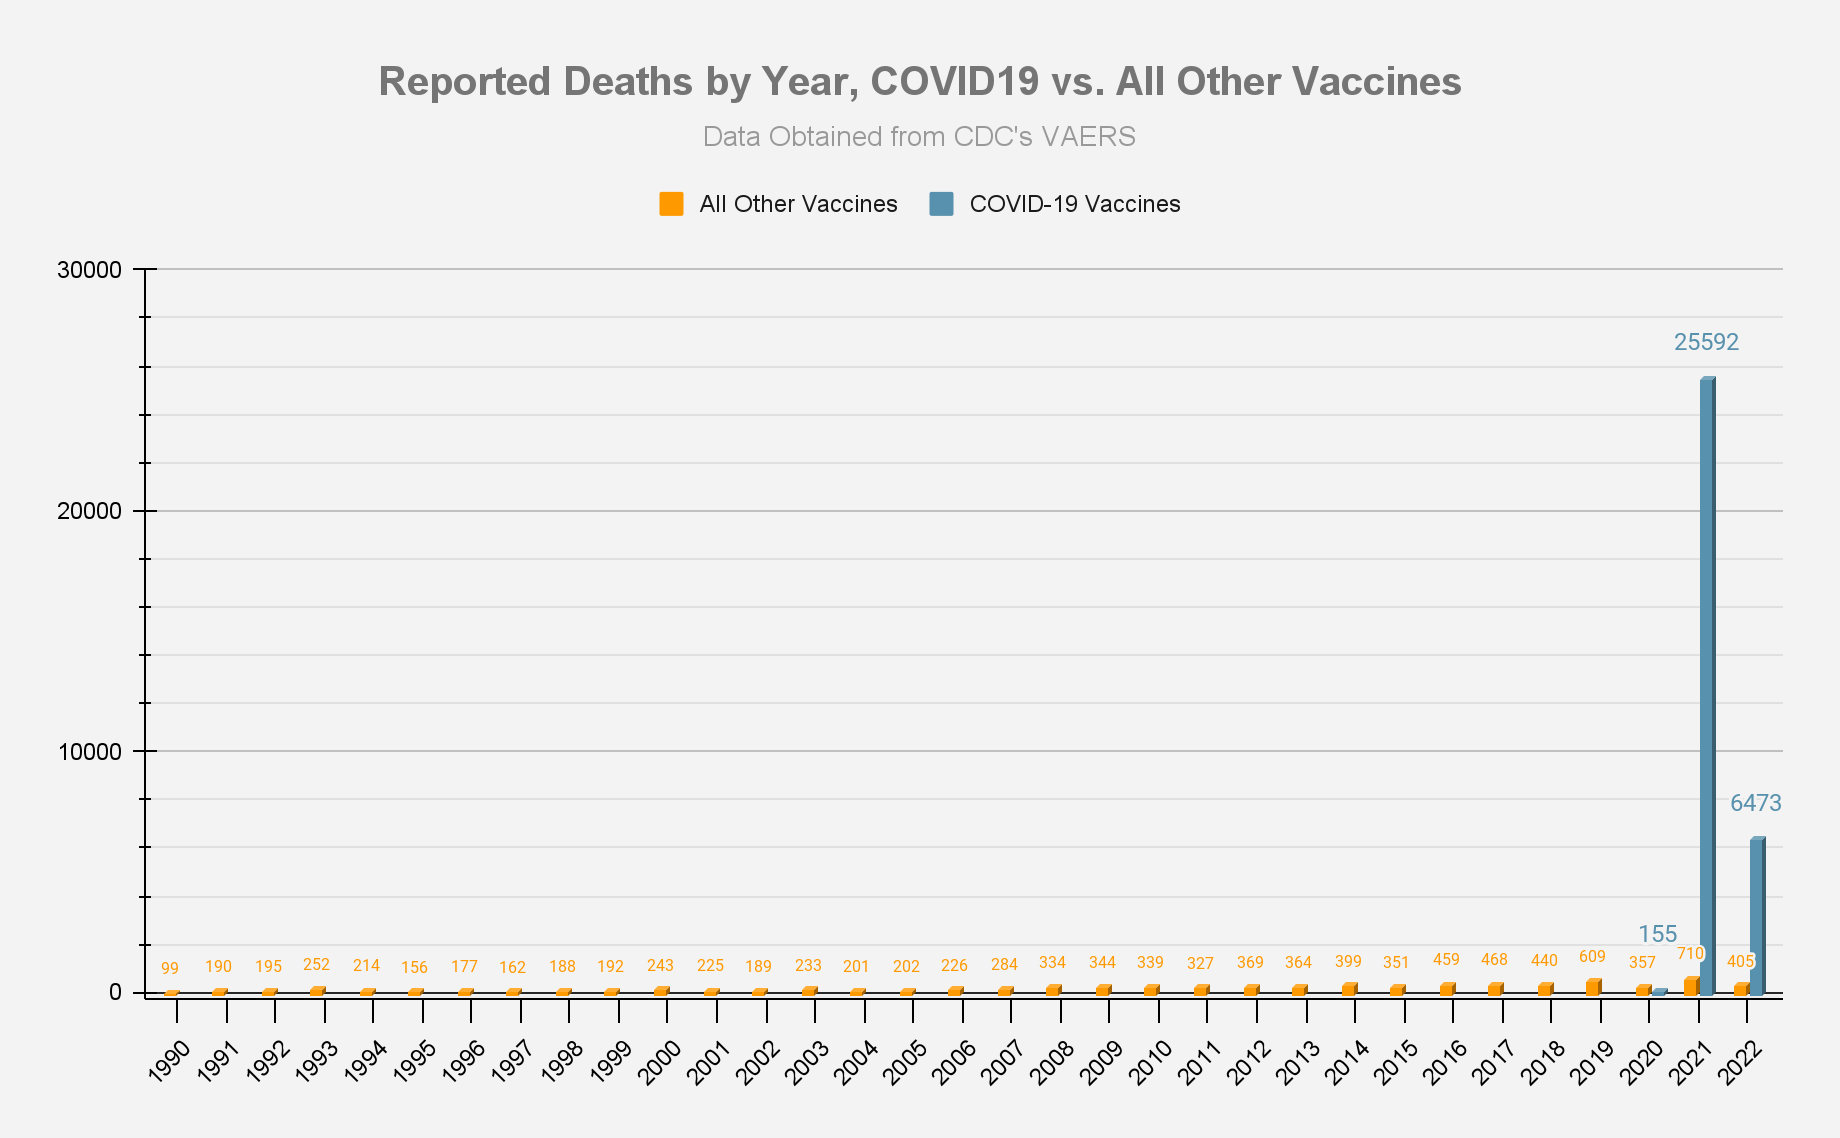
| Number of Deaths | 32,220* | 9,992* | 15,311 | 5,453 |
| # of Permanent Disabilities after vaccination | 60,099 | 21,526 | 15,404 | 13,298 |
| Number of Office Visits | 212,828 | 55,183 | 175,775 | 52,651 |
| # of Emergency Room/Department Visits | 138,925 | 215,148 | 106,163 | 205,347 |
| # of Birth Defects after vaccination | 1,183 | 206 | 558 | 112 |
Deaths


[Vaccines not included above (due to n < 20 overall deaths): Adenovirus, Cholera, Dengue Fever, Encephalitis, Ebola, Lyme, Mumps, Pertussis, Plague, Rubella, Smallpox]
Adverse Events


[Vaccines not included above (due to n < 500 overall AEs): Adenovirus, Cholera, Dengue Fever, Ebola, Mumps, Pertussis, Plague]
Symptoms
The slide below was taken from an FDA document from October 22, 2020 and provides a list of possible adverse event outcomes related to the Covid-19 vaccines.
- Source: “Vaccines and Related Biological Products Advisory Committee October 22,2020 Meeting Presentation“.
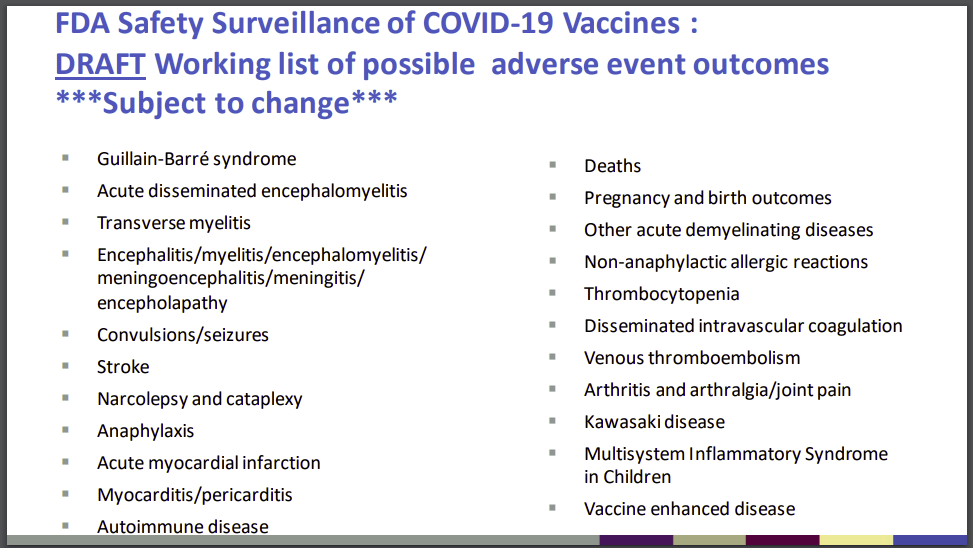
The following table lists the number of adverse events found in the VAERS data which match the outcomes listed above:
| FDA Listed Symptom | Total (Non-Lethal) Adverse Events for Covid-19 Vaccine | Total Deaths for Covid-19 Vaccine | Total (Non-Lethal) Adverse Events for All Other Vaccines (1990-present) | Total Deaths for All Other Vaccines (1990-present) |
|---|---|---|---|---|
| Guillain-Barre | 3041 | 66 | 4562 | 145 |
| Acute Disseminated Encephalomyelitis | 234 | 7 | 452 | 30 |
| Transverse Myelitis | 627 | 6 | 846 | 16 |
| Encephalitis | 2971 | 409 | 4915 | 476 |
| Convulsions/Seizures | 15617 | 495 | 29917 | 532 |
| Stroke | 10880 | 868 | 1556 | 95 |
| Narcolepsy, Cataplexy | 266 | 4 | 378 | 3 |
| Anaphylaxis | 50517 | 166 | 41901 | 170 |
| Acute Myocardial Infarction (Heart Attack) | 5776 | 1606 | 354 | 156 |
| Myocarditis/Pericarditis | 24319 | 386 | 1006 | 89 |
| Autoimmune Disease | 2489 | 36 | 1154 | 17 |
| Other Acute Demyelinating Diseases | 448 | 7 | 871 | 25 |
| Pregnancy and birth outcomes (Miscarriages) | 4849 | 149 | 2914 | 50 |
| Other Allergic Reactions | 2645 | 4 | 2104 | 3 |
| Thrombocytopenia | 4896 | 417 | 3455 | 130 |
| Disseminated Intravascular Coagulation | 292 | 93 | 61 | 26 |
| Venous Thromboembolism | 26949 | 1618 | 713 | 116 |
| Arthritis and Arthralgia/Joint Pain | 86440 | 295 | 29626 | 79 |
| Kawasaki Disease | 90 | 2 | 724 | 8 |
| Systemic Inflammatory Response Syndrome | 1010 | 65 | 369 | 7 |
Vaccination Related Risks of COVID19 Vs. Flu
These set of figures compare the COVID19 vaccine to the traditional Flu vaccines. ‘Risk of Death’ percentages depend on the ‘# of Vaccinations’ data, which is only approximate, and was pulled from the CDC’s report on Flu vaccination coverage for the 2019-2020 season, and from CDC’s Vaccination Trends in the US for the COVID19 vaccinations.
Covid19 vaccinations through 5/31/2021 vs. Flu vaccinations 7/1/2019 – 5/31/2020 (last complete flu season)
| Vaccine Type | # of Vaccinations[3] | # of Deaths | Risk of Death | Percentage | Deaths/Mill. Vaccinations[3] |
|---|---|---|---|---|---|
| Flu | 167,447,642[1] | 33 | 1 in 5,074,171 | 0.000020% | 0.20 |
| COVID19 | 173,629,456[2] | 6,044 | 1 in 28,728 | 0.003481% | 34.81 |
| Vaccine Type | # of Vaccinations[3] | # of Adverse Reactions | Risk of Adverse Reaction | Percentage | AEs/Mill. Vaccinations[3] |
|---|---|---|---|---|---|
| Flu | 167,447,642 | 9,735 | 1 in 17,201 | 0.005814% | 58.14 |
| COVID19 | 173,629,456 | 573,907 | 1 in 303 | 0.330536% | 3,305.36 |
[1] number of flu vaccinations based on estimated flu vaccine coverage data from CDC and estimated population data from US Census. Yearly flu vaccination data covers a period of time from 7/1 to 5/31 of the following year.
[2] number of covid19 vaccinations based on estimates from CDC’s Vaccination Trends in the US [2]
[3] Persons vaccinated with at least one dose.
Vaccine Data by Manufacturer
| Manufacturer | # of Deaths | % Deaths | Average Deaths/Day | # US Deaths | US Doses Administered | Average US Deaths/Mill. Doses | Days since EUA approval | EUA Approval Date- |
|---|---|---|---|---|---|---|---|---|
| JANSSEN | 2,790 | 8.62% | 4.48 | 1,816 | 18,948,166 | 95.84 | 623 | 2/26/21 |
| MODERNA | 8,836 | 27.29% | 12.75 | 6,514 | 243,881,608 | 26.71 | 693 | 12/18/20 |
| PFIZER\BIONTECH | 20,473 | 63.24% | 29.25 | 6,919 | 387,174,835 | 17.87 | 700 | 12/11/20 |
| UNKNOWN MANUFACTURER | 208 | 0.64% | 61 | 751,357 | ||||
| PFIZER\BIONTECH-Bivalent | 48 | 0.15% | 0.68 | 46 | 22,681,194 | 2.03 | 71 | 9/1/22 |
| MODERNA-Bivalent | 21 | 0.06% | 0.3 | 21 | 12,715,605 | 1.65 | 71 | 9/1/22 |
| Manufacturer | # of AEs | % AEs | Average AEs/Day | # US AEs | US Doses Administered | Average US AEs/Mill. Doses | Days since EUA approval | EUA Approval Date |
|---|---|---|---|---|---|---|---|---|
| JANSSEN | 95,640 | 6.49% | 153.52 | 71,093 | 18,948,166 | 3751.97 | 623 | 2/26/21 |
| MODERNA | 492,705 | 33.45% | 710.97 | 406,269 | 243,881,608 | 1665.85 | 693 | 12/18/20 |
| PFIZER\BIONTECH | 866,851 | 58.85% | 1238.36 | 412,325 | 387,174,835 | 1064.96 | 700 | 12/11/20 |
| UNKNOWN MANUFACTURER | 8,902 | 0.6% | 4,536 | 751,357 | ||||
| NOVAVAX | 161 | 0.01% | 1.33 | 150 | 54,324 | 2761.21 | 121 | 7/13/22 |
| PFIZER\BIONTECH-Bivalent | 4,864 | 0.33% | 68.51 | 4,840 | 22,681,194 | 213.39 | 71 | 9/1/22 |
| MODERNA-Bivalent | 4,019 | 0.27% | 56.61 | 4,002 | 12,715,605 | 314.73 | 71 | 9/1/22 |
Vaccine Data by Gender

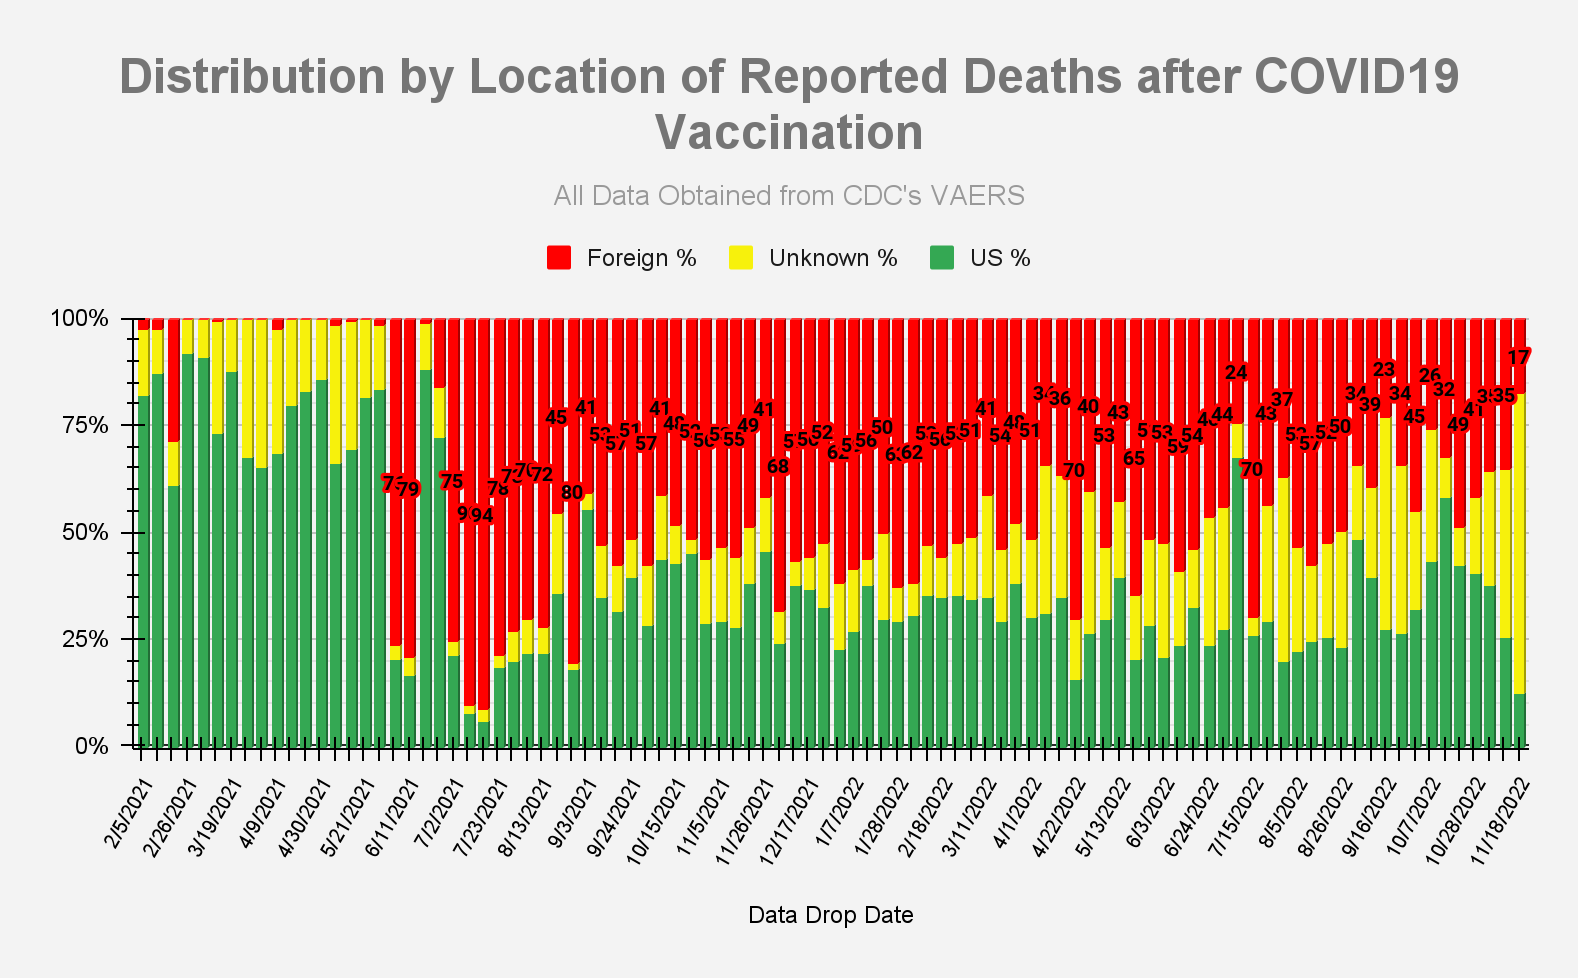
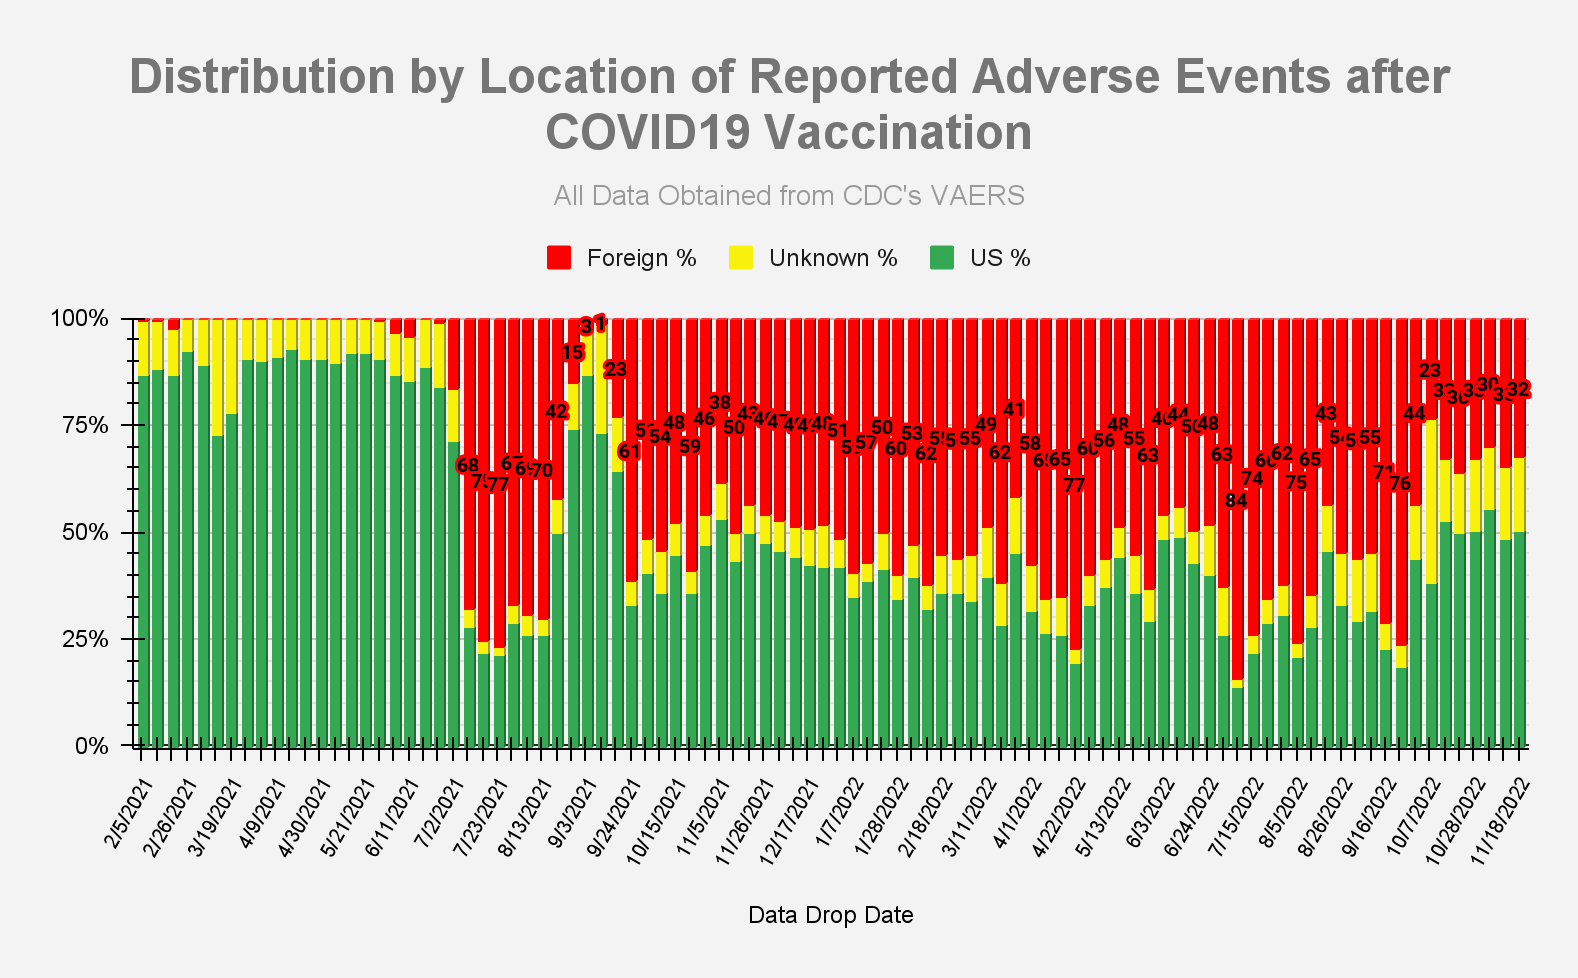
Vaccine Data by Location
VAERS Weekly Publication History
Lag Time To Publish History
[Note that N-Acetylcysteine and Quercetin have 0 reported deaths]
Recall History
*Projected
Alternative Covid-19 Therapeutics
Sources
- Vaccine data (Covid-19 and other vaccines) taken from CDC’s VAERS website, located here: https://vaers.hhs.gov/data/datasets.html. VAERS data sets in the form of csv files are pulled down weekly and put into a database for reporting/analysis. Data files are available all the way back to 1990.
- Number of doses distributed for other vaccines found in NVICP Data and Statistics report here: https://www.hrsa.gov/sites/default/files/hrsa/vaccine-compensation/data/data-statistics-report.pdf
- Numbers for Covid-19 vaccines administered by manufacturer found here: https://covid.cdc.gov/covid-data-tracker/#vaccinations_vacc-total-admin-rate-total
- Numbers for total Covid-19 vaccine doses administered found here: https://data.cdc.gov/Vaccinations/COVID-19-Vaccination-Trends-in-the-United-States-N/rh2h-3yt2
- Numbers for Flu vaccine doses administered for 2019-2020 season found here: https://www.cdc.gov/flu/fluvaxview/coverage-1920estimates.htm
- Numbers for FDA regulated drugs taken from FDA’s FAERS website, located here: https://www.fda.gov/drugs/questions-and-answers-fdas-adverse-event-reporting-system-faers/fda-adverse-event-reporting-system-faers-public-dashboard
Other Important Posts
- Some VAERS records are deleted every week:
- VAERS throttles data and also removes records before ever releasing them (death record of 2 year old was never published):
- Best evidence of harm from Covid-19 vaccines using specific examples from VAERS:
- 37 examples from this post (from 2/22/22): https://vaersanalysis.info/2022/02/03/the-best-evidence-of-vax-related-deaths-in-vaers-part-ii-and-a-history-lesson-courtesy-of-vioxx/
- 41 examples from this post (from 10/4/21): https://vaersanalysis.info/2021/10/04/the-best-vaers-evidence-of-covid-19-vax-related-deaths/
- Downloadable excel showing frequency of all the symptoms associated with Covid-19 vaccines:
- Hot Lot information (including downloadable excel with all the lot numbers and frequency of adverse events):
- Deaths and adverse events broken down by state:
- Exposing the fraud in the Pfizer clinical trial:
- Breakdown of VAERS reporting percentages by medical professionals vs. laypeople:
- Lack of quality control of the VAERS data:
- Safety of alternative treatments for Covid-19:
I passed out when I got my Covid shot (J&J) and the next day my body was covered in hives. They lasted about 24 hours and went away. Then a few months after I began getting itchy, mostly on the palms of my hands, but then started getting theses welts that itched madly. I thought they were spider bites for a while, until they continued to get more frequent, on a daily basis. I had pest control come and check my house for spiders, which he said I had none, but could be an allergy. So began the many Dr. visits and tests. By this time The welts were large, itchy and burning. I was referred to an allergist who said it was pressure hives. I was getting them in the muscle, which was really painful when in the bottom of my feet. But they would be on the back of my legs if I squatted down, the bend of my arm, the heel of my hand from working the mouse for my laptop or anywhere I scratched. The Dr had me taking lots of antihistamines which made me, bloated, depressed and I only wanted to sleep. I’m a dog trainer and was teaching 7 classes a week. This was debilitating as I was unable to teach my classes or plan events. This went on for a year. Then my Dr had me start taking the Xolair shot, which are very expensive. My insurance covered some of it and the rest is covered under the companies assistance program. However, this has been a lifesaver! The hives are gone 3 months now. I will have to take them for 6 months (once per month) and see what happens. Hopefully I can go back to normal, before the covid shot. My Dr says its not because of the shot, but for someone who never gets sick, but maybe a cold, I never get the flue shot or get the flue and have no other medical problems and only go to the Dr for annual check ups, something just doesn’t add up.