All charts and tables below reflect the data release on 8/06/2021 from the VAERS website, which includes U.S. and foreign data, and is updated through: 7/30/2021
| High-Level Summary | COVID19 vaccines (Dec’2020 – present) | All other vaccines 1990-present | US Data Only COVID19 vaccines (Dec’2020 – present) | US Data Only All other vaccines 1990-present |
|---|---|---|---|---|
| Number of Adverse Reactions | 571,831 | 812,603 | 451,049 | 712,541 |
| Number of Life-Threatening Events | 13,139 | 13,383 | 7,603 | 9,546 |
| Number of Hospitalizations | 51,242 | 77,634 | 26,798 | 37,594 |
| Number of Deaths | 12,791* | 8,867 | 5,859 | 5,005 |
| # of Permanent Disabilities after vaccination | 16,044 | 18,944 | 6,654 | 11,895 |
| Number of Office Visits | 95,886 | 42,049 | 90,432 | 40,793 |
| # of Emergency Room/Department Visits | 70,610 | 208,849 | 61,956 | 199,944 |
| # of Birth Defects after vaccination | 351 | 133 | 254 | 86 |
Deaths


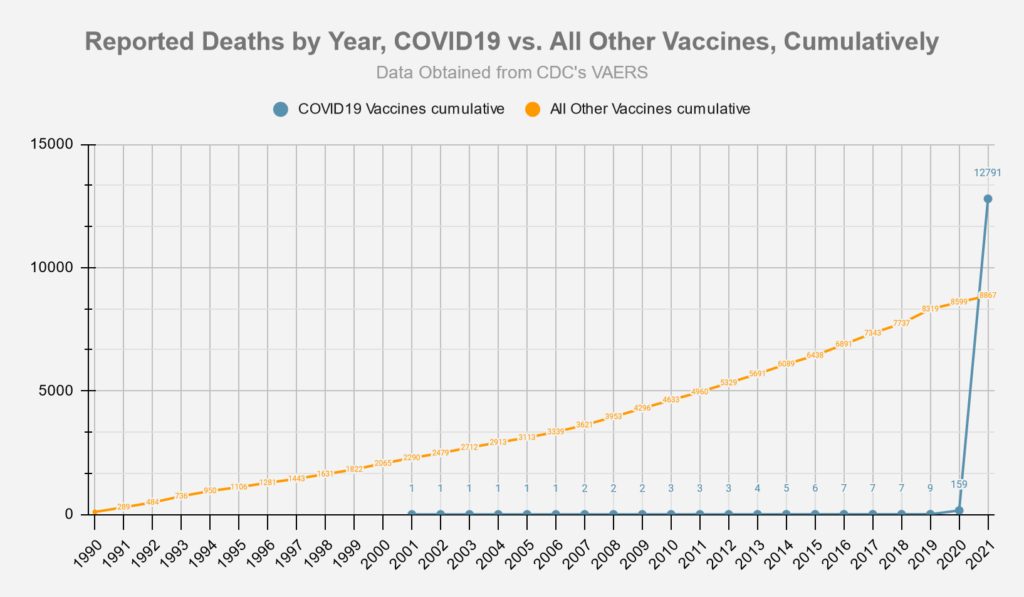
Chart using comparable 8 month periods, since Covid-19 vaccines have only been available for approximately 8 months:


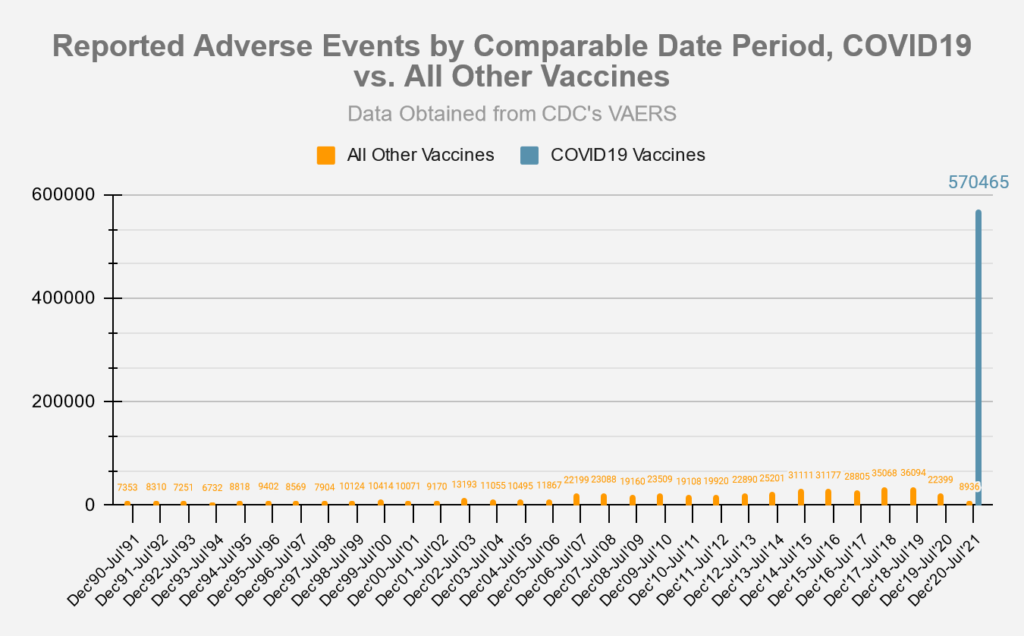
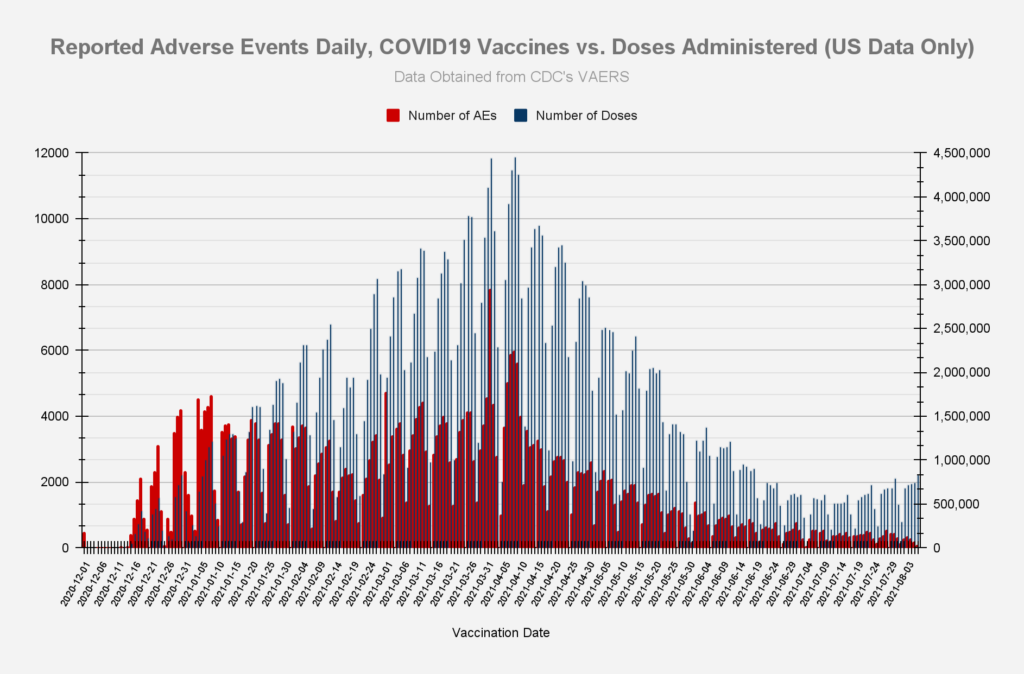
Adverse Events
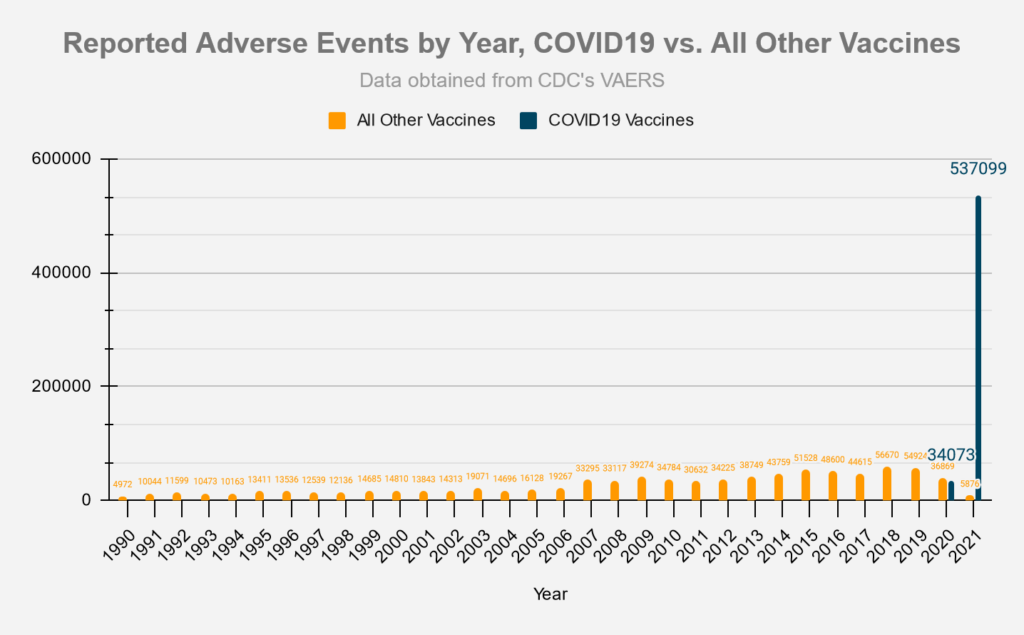
Chart using comparable 8 month periods, since Covid-19 vaccines have only been available for approximately 8 months:

Symptoms
The slide below was taken from an FDA document from October 22, 2020 and provides a list of possible adverse event outcomes related to the Covid-19 vaccines.
- Source: ‘Vaccines and Related Biological Products Advisory Committee October 22,2020 Meeting Presentation”.
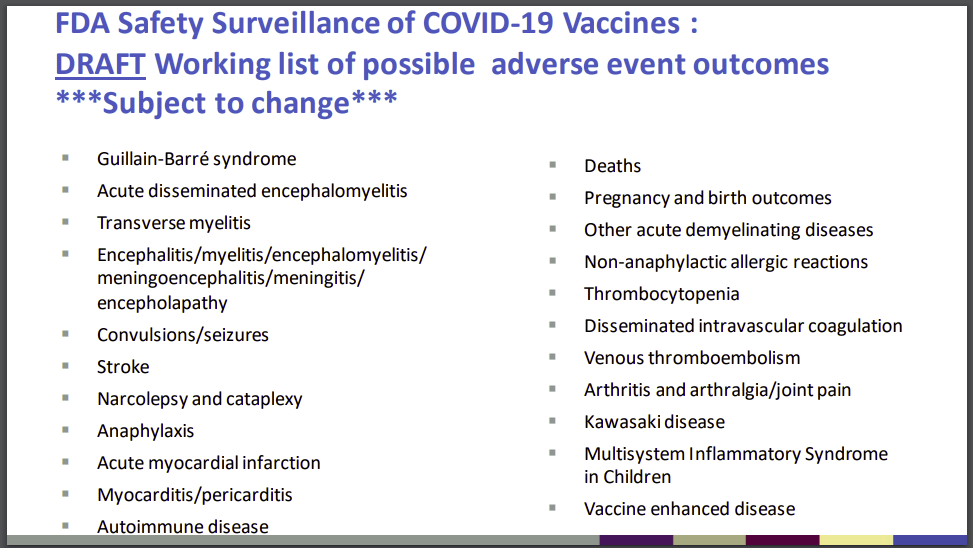
The following table lists the number of adverse events found in the VAERS data which match the outcomes listed above:
| FDA Listed Symptom | Total (Non-Lethal) Adverse Events | Total Deaths |
|---|---|---|
| Guillain-Barre | 834 | 17 |
| Acute Disseminated Encephalomyelitis | 56 | 1 |
| Transverse Myelitis | 185 | 0 |
| Encephalitis | 737 | 77 |
| Convulsions/Seizures | 7421 | 227 |
| Stroke | 7008 | 720 |
| Narcolepsy, Cataplexy | 117 | 3 |
| Anaphylaxis | 27875 | 123 |
| Acute Myocardial Infarction (Heart Attack) | 1861 | 656 |
| Myocarditis/Pericarditis | 3607 | 57 |
| Autoimmune Disease | 480 | 12 |
| Other Acute Demyelinating Diseases | 117 | 1 |
| Pregnancy and birth outcomes (Miscarriages) | 1439 | 37 |
| Other Allergic Reactions | 998 | 1 |
| Thrombocytopenia | 2162 | 180 |
| Disseminated Intravascular Coagulation | 92 | 33 |
| Venous Thromboembolism | 10072 | 583 |
| Arthritis and Arthralgia/Joint Pain | 38324 | 106 |
| Kawasaki Disease | 25 | 0 |
| Systemic Inflammatory Response Syndrome | 310 | 17 |
Vaccination Related Risks of COVID19 Vs. Flu
These set of figures compare the COVID19 vaccine to the traditional Flu vaccines. ‘Risk of Death’ percentages depend on the ‘# of Vaccinations’ data, which is only approximate, and was pulled from the CDC’s report on Flu vaccination coverage for the 2019-2020 season, and from Our World in Data for the COVID19 vaccinations.
Covid19 vaccinations through 5/31/2021 vs. Flu vaccinations 7/1/2019 – 5/31/2020 (last complete flu season)
| Vaccine Type | # of Vaccinations | # of Deaths | Risk of Death | Percentage |
|---|---|---|---|---|
| Flu | 167,447,642[1] | 91 | 1 in 1,840,083 | 0.000054% |
| COVID19 | 167,733,972[2] | 10,538 | 1 in 15,917 | 0.006283% |
| Vaccine Type | # of Vaccinations | # of Adverse Reactions | Risk of Adverse Reaction | Percentage |
|---|---|---|---|---|
| Flu | 167,447,642 | 10,448 | 1 in 16,027 | 0.006231% |
| COVID19 | 167,733,972 | 516,699 | 1 in 325 | 0.3080% |
[1] number of flu vaccinations based on estimated flu vaccine coverage data from CDC and estimated population data from US Census. Yearly flu vaccination data covers a period of time from 7/1 to 5/31 of the following year.
[2] number of covid19 vaccinations based on estimates from Our World in Data

Vaccine Data by Manufacturer
| Manufacturer | # of Deaths | % Deaths | Average Deaths/Day | Doses Administered | Average Deaths/Mill. Doses | Days since EUA approval | EUA Approval Date- |
|---|---|---|---|---|---|---|---|
| Janssen (JNJ) | 691 | 5.4% | 4.29 | 13,784,136 | 50.13 | 161 | 2/26/2021 |
| Moderna | 3231 | 25.24% | 13.99 | 141,011,089 | 22.91 | 231 | 12/18/2020 |
| Pfizer/Biontech | 8839 | 69.06% | 37.14 | 198,736,053 | 44.48 | 238 | 12/11/2020 |
| Unknown | 38 | 0.3% | 328,616 |
| Manufacturer | # of AEs | % AEs | Average AEs/Day | Doses Administered | Average AEs/Mill. Doses | Days since EUA approval | EUA Approval Date |
|---|---|---|---|---|---|---|---|
| Janssen (JNJ) | 48749 | 8.52% | 302.79 | 13,784,136 | 3536.60 | 161 | 2/26/2021 |
| Moderna | 208264 | 36.39% | 901.58 | 141,011,089 | 1476.93 | 231 | 12/18/2020 |
| Pfizer/Biontech | 314107 | 54.88% | 1319.78 | 198,736,053 | 1580.52 | 238 | 12/11/2020 |
| Unknown | 1192 | 0.22% | 328,616 |
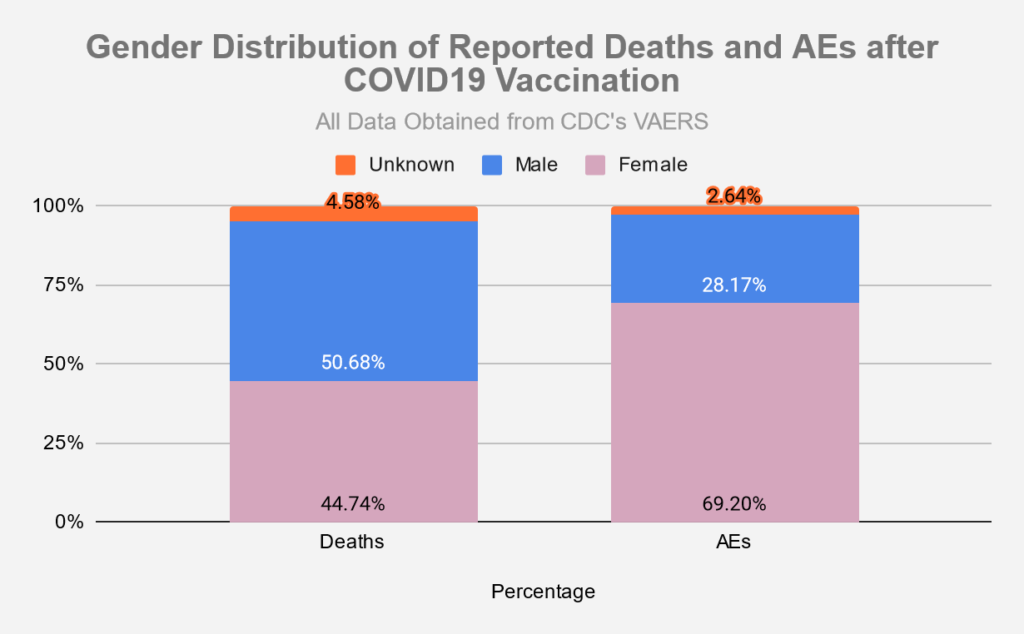
Vaccine Data by Gender
Ctrl + F “15,9174” it should be “15,917”
Thanks Anon! Much appreciated!
This data feels biased, I see you reuse the same data, just in different graph representations. You are missing a big part of data which is the number of covid vaccines vs other vaccines. You just show it at the very end and only for flu, but not for all the other graphs where you compare the number of deaths. You could keep the number of deaths, but you should show the percentage of deaths of every 100 people vaccinated, I see it in your data at some point, but not in the graphs. You should put the number “0.006283%” that you have, this is the percentage of covid deaths which is clearly less than 1% and in your graph you make it seem as if the probability was so much higher. Also, you only put age distribution for covid deaths which the majority is 65+, what about age distribution for other vaccines? This is important because a person 65+ has higher chances of dying(of anything, not just the vaccine) than a young person
whether it “feels” biased or not, this site reports on the data…the data is the data…if the covid shots were less dangerous, you would see it in the data and associated charts…
and yes, the number of vaxes administered is a big part of the equation…however, for the other vaxes it is also the harder number to find, and quite involved to figure out, plus the data is more sparse. As you’ve said, I’ve done it for Flu vaxes for the previous full season. If I had all the time in the world, then yes, perhaps I could get or figure out more of those vax numbers, but this website is primarily focused on reporting VAERS data (esp. covid), which obviously doesn’t include the number of vaxes administered in it.