All charts and tables below reflect the data release on 12/3/2021 from the VAERS website, which includes U.S. and foreign data, and is updated through: 11/26/2021
| High-Level Summary | COVID19 vaccines (Dec’2020 – present) | All other vaccines 1990-present | US Data Only COVID19 vaccines (Dec’2020 – present) | US Data Only All other vaccines 1990-present |
|---|---|---|---|---|
| Number of Adverse Reactions | 927,740 | 859,919 | 672,373 | 749,867 |
| Number of Life-Threatening Events | 21,931 | 14,160 | 10,325 | 9,855 |
| Number of Hospitalizations | 99,943 | 81,992 | 42,124 | 38,628 |
| Number of Deaths | 19,532* | 9,319 | 8,986 | 5,205 |
| # of Permanent Disabilities after vaccination | 31,652 | 20,459 | 10,409 | 12,716 |
| Number of Office Visits | 145,285 | 48,202 | 129,569 | 46,263 |
| # of Emergency Room/Department Visits | 102,544 | 211,875 | 83,855 | 202,496 |
| # of Birth Defects after vaccination | 691 | 174 | 400 | 99 |
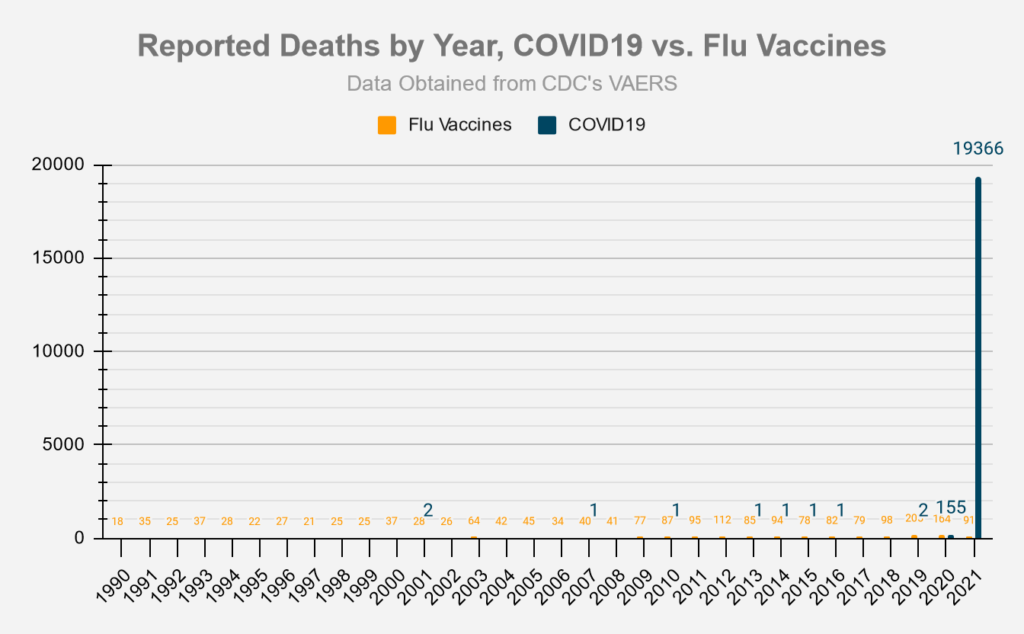
Deaths
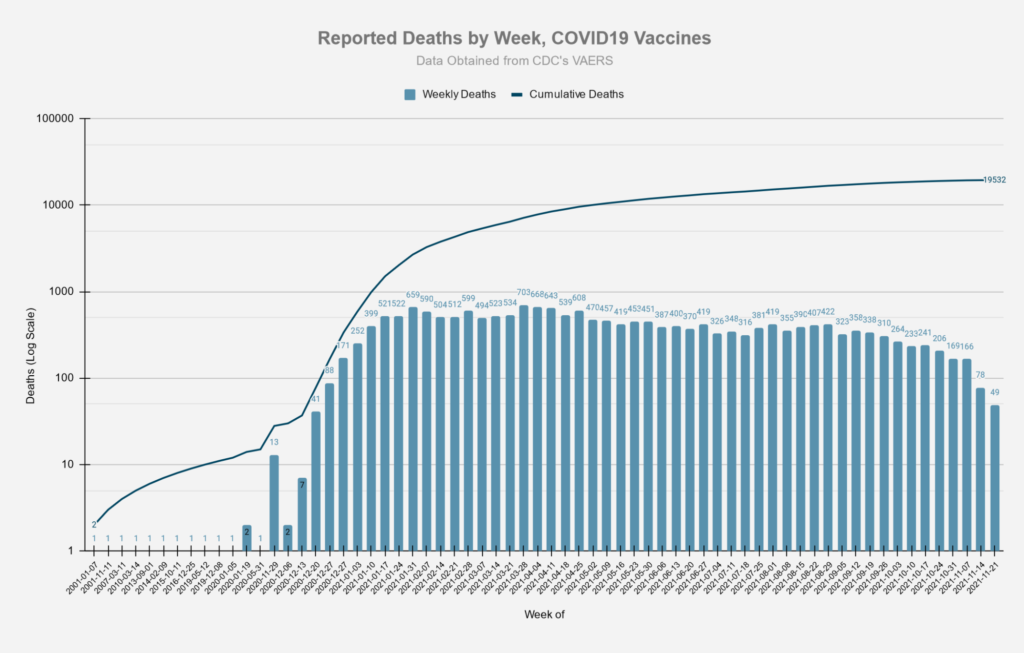
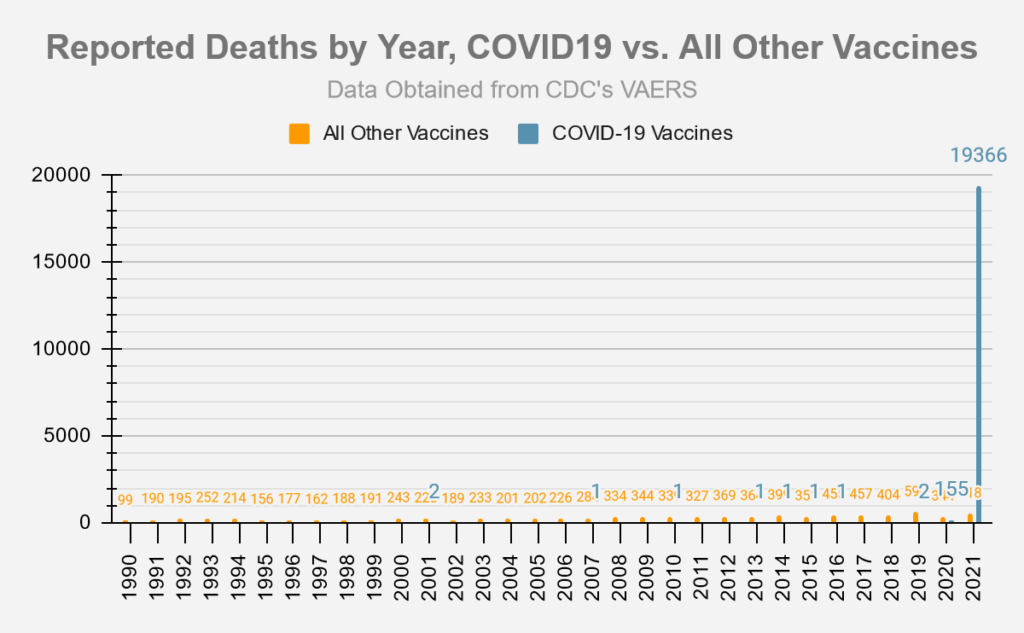
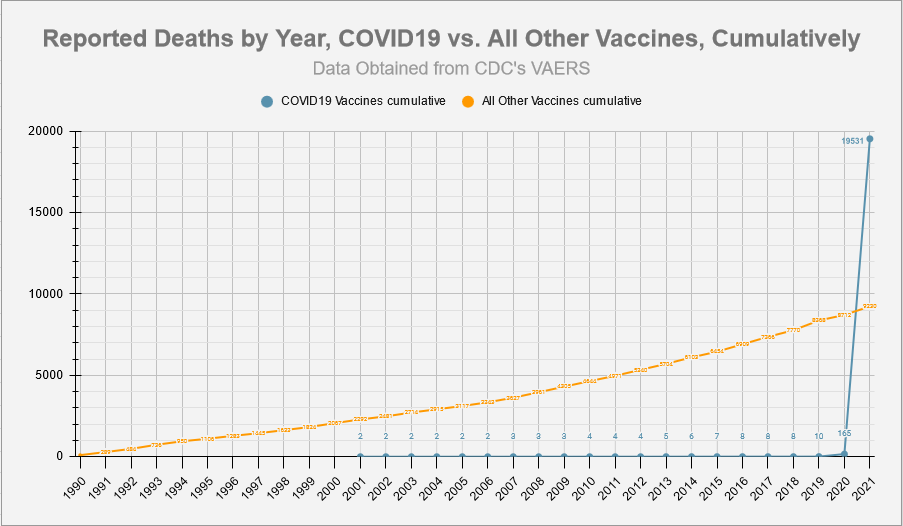
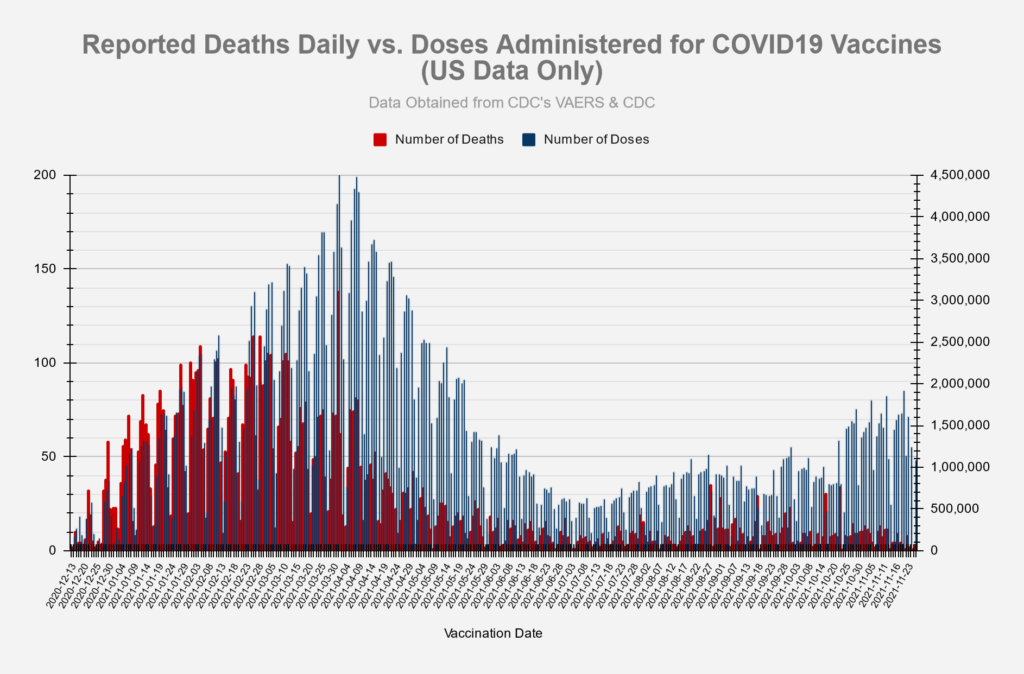
Chart using comparable 11 month periods, since Covid-19 vaccines have only been available for approximately 11 months:


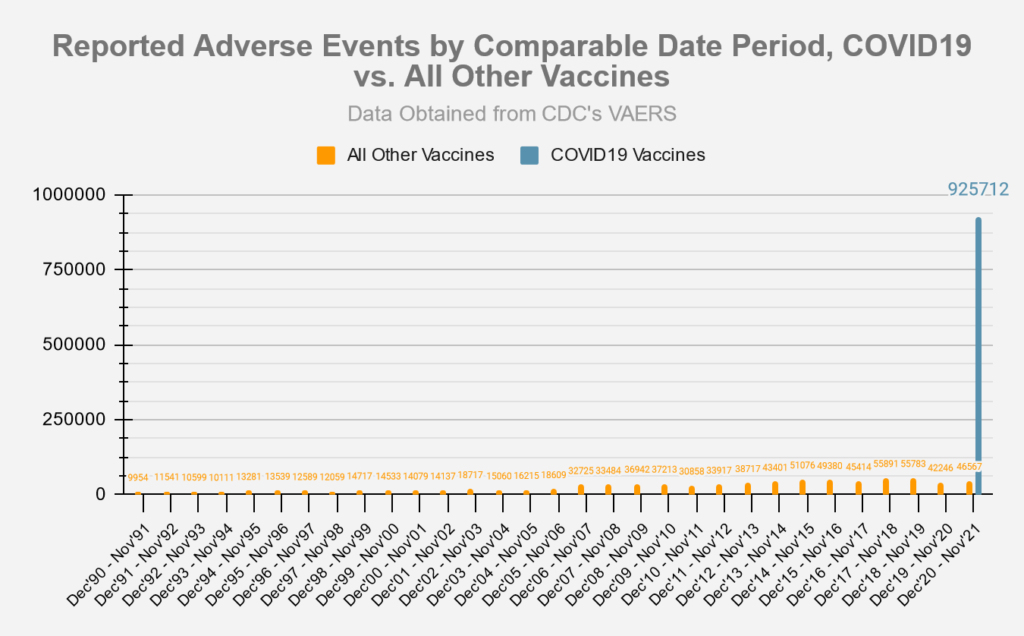
Adverse Events
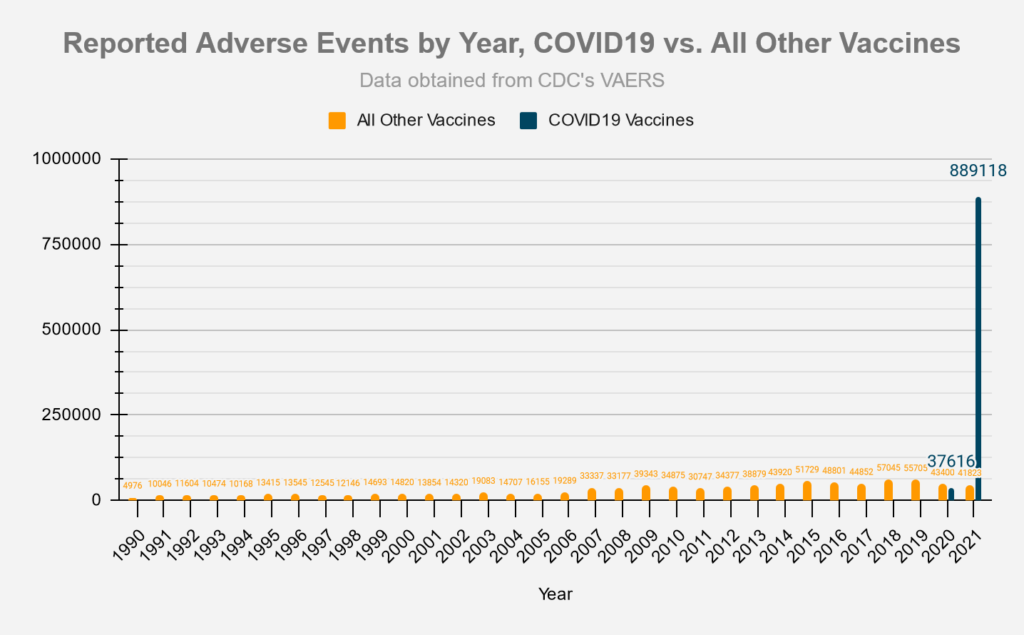
Chart using comparable 11 month periods, since Covid-19 vaccines have only been available for approximately 11 months:

Symptoms
The slide below was taken from an FDA document from October 22, 2020 and provides a list of possible adverse event outcomes related to the Covid-19 vaccines.
- Source: ‘Vaccines and Related Biological Products Advisory Committee October 22,2020 Meeting Presentation”.
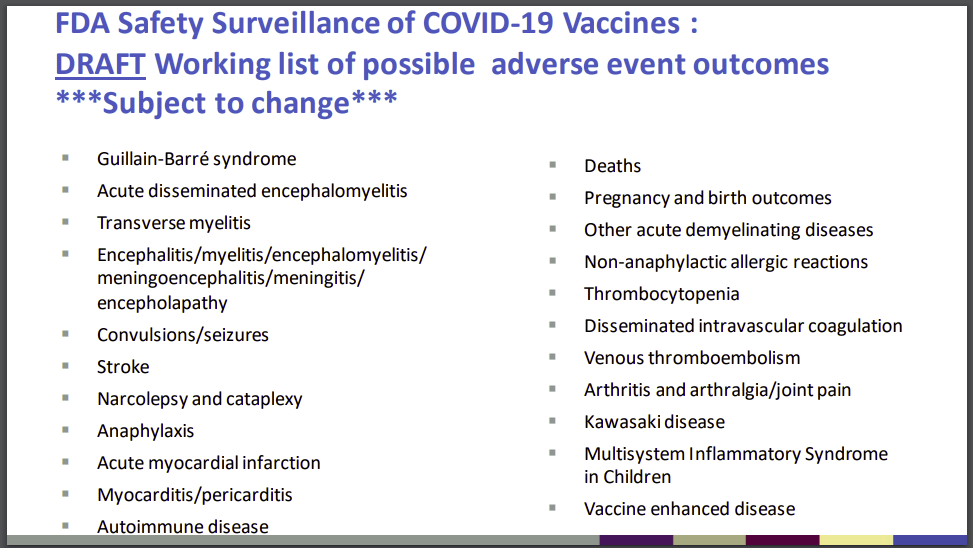
The following table lists the number of adverse events found in the VAERS data which match the outcomes listed above:
| FDA Listed Symptom | Total (Non-Lethal) Adverse Events | Total Deaths |
|---|---|---|
| Guillain-Barre | 1796 | 32 |
| Acute Disseminated Encephalomyelitis | 127 | 3 |
| Transverse Myelitis | 318 | 2 |
| Encephalitis | 1487 | 148 |
| Convulsions/Seizures | 11745 | 337 |
| Stroke | 11117 | 1005 |
| Narcolepsy, Cataplexy | 233 | 5 |
| Anaphylaxis | 39972 | 156 |
| Acute Myocardial Infarction (Heart Attack) | 3230 | 982 |
| Myocarditis/Pericarditis | 11825 | 148 |
| Autoimmune Disease | 1039 | 21 |
| Other Acute Demyelinating Diseases | 233 | 3 |
| Pregnancy and birth outcomes (Miscarriages) | 2957 | 86 |
| Other Allergic Reactions | 1750 | 3 |
| Thrombocytopenia | 3981 | 298 |
| Disseminated Intravascular Coagulation | 171 | 52 |
| Venous Thromboembolism | 17119 | 942 |
| Arthritis and Arthralgia/Joint Pain | 60604 | 177 |
| Kawasaki Disease | 46 | 1 |
| Systemic Inflammatory Response Syndrome | 548 | 39 |
Vaccination Related Risks of COVID19 Vs. Flu
These set of figures compare the COVID19 vaccine to the traditional Flu vaccines. ‘Risk of Death’ percentages depend on the ‘# of Vaccinations’ data, which is only approximate, and was pulled from the CDC’s report on Flu vaccination coverage for the 2019-2020 season, and from Our World in Data for the COVID19 vaccinations.
Covid19 vaccinations through 5/31/2021 vs. Flu vaccinations 7/1/2019 – 5/31/2020 (last complete flu season)
| Vaccine Type | # of Vaccinations[3] | # of Deaths | Risk of Death | Percentage | Deaths/Mill. Vaccinations[3] |
|---|---|---|---|---|---|
| Flu | 167,447,642[1] | 33 | 1 in 5,074,171 | 0.000020% | .20 |
| COVID19 | 167,733,972[2] | 5,576 | 1 in 30,108 | 0.003324% | 33.24 |
| Vaccine Type | # of Vaccinations[3] | # of Adverse Reactions | Risk of Adverse Reaction | Percentage | AEs/Mill. Vaccinations[3] |
|---|---|---|---|---|---|
| Flu | 167,447,642 | 9,709 | 1 in 17,247 | 0.005798% | 57.98 |
| COVID19 | 167,733,972 | 529,838 | 1 in 317 | 0.3159% | 3,159 |
[1] number of flu vaccinations based on estimated flu vaccine coverage data from CDC and estimated population data from US Census. Yearly flu vaccination data covers a period of time from 7/1 to 5/31 of the following year.
[2] number of covid19 vaccinations based on estimates from Our World in Data [2] number of covid19 vaccinations based on estimates from Our World in Data
[3] Persons vaccinated with at least one dose.
Vaccine Data by Manufacturer
| Manufacturer | # of Deaths | % Deaths | Average Deaths/Day | # US Deaths | US Doses Administered | Average US Deaths/Mill. Doses | Days since EUA approval | EUA Approval Date- |
|---|---|---|---|---|---|---|---|---|
| Janssen (JNJ) | 1622 | 8.3% | 5.94 | 1035 | 16,720,690 | 61.9 | 273 | 2/26/2021 |
| Moderna | 4799 | 24.55% | 13.99 | 3783 | 177,388,926 | 21.33 | 343 | 12/18/2020 |
| Pfizer/Biontech | 13044 | 66.74% | 37.27 | 4136 | 269,856,321 | 15.33 | 350 | 12/11/2020 |
| Unknown | 79 | 0.4% | 40 | 479,643 |
| Manufacturer | # of AEs | % AEs | Average AEs/Day | # US AEs | US Doses Administered | Average US AEs/Mill. Doses | Days since EUA approval | EUA Approval Date |
|---|---|---|---|---|---|---|---|---|
| Janssen (JNJ) | 69582 | 7.49% | 254.88 | 60313 | 16,720,690 | 3607.09 | 273 | 2/26/2021 |
| Moderna | 344599 | 37.09% | 1004.66 | 311219 | 177,388,926 | 1754.44 | 343 | 12/18/2020 |
| Pfizer/Biontech | 512862 | 55.2% | 1465.32 | 300447 | 269,856,321 | 1113.36 | 350 | 12/11/2020 |
| Unknown | 2041 | 0.22% | 1527 | 479,643 |
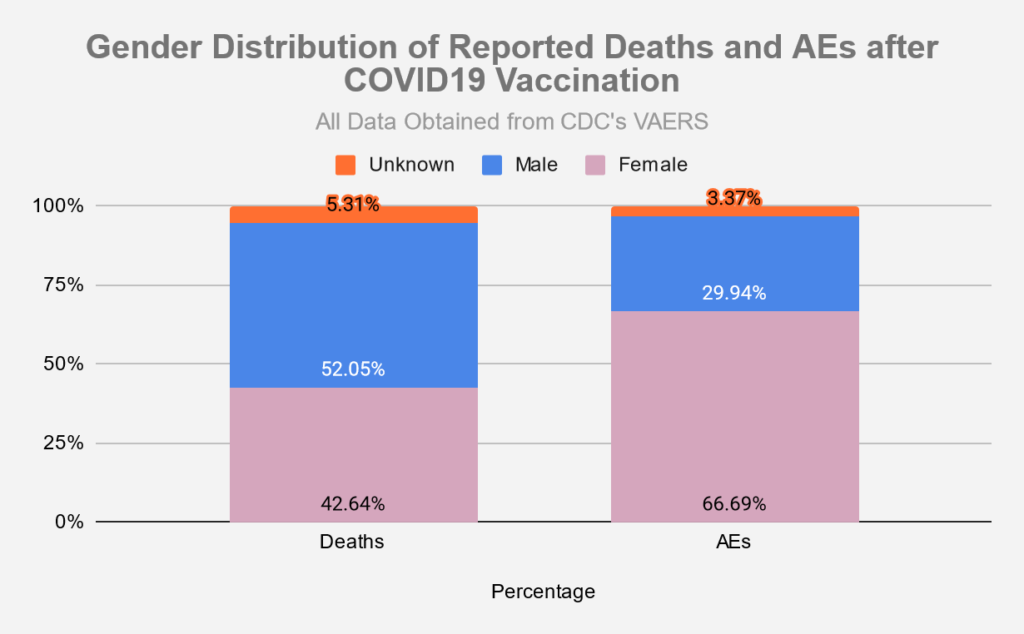
Vaccine Data by Gender
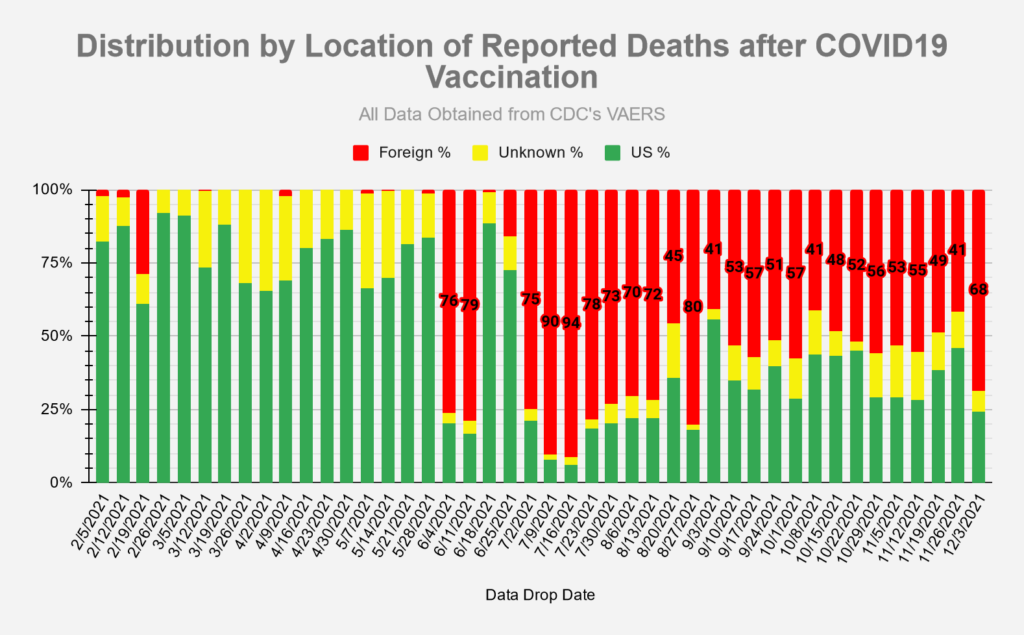
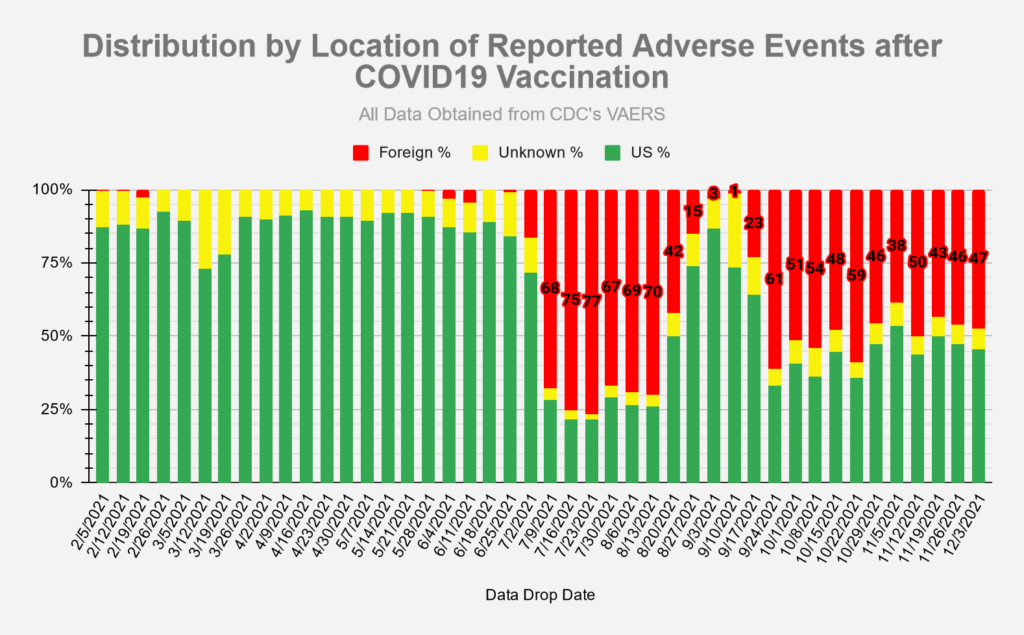
Vaccine Data by Location
Recall History
Sources
- Vaccine data (Covid-19 and other vaccines) taken from CDC’s VAERS website, located here: https://vaers.hhs.gov/data/datasets.html. VAERS data sets in the form of csv files are pulled down weekly and put into a database for reporting/analysis. Data files are available all the way back to 1990.
- Number of doses distributed for other vaccines found in NVICP Data and Statistics report here: https://www.hrsa.gov/sites/default/files/hrsa/vaccine-compensation/data/data-statistics-report.pdf
- Numbers for Covid-19 vaccines administered by manufacturer found here: https://covid.cdc.gov/covid-data-tracker/#vaccinations_vacc-total-admin-rate-total
- Numbers for total Covid-19 vaccine doses administered found here: https://data.cdc.gov/Vaccinations/COVID-19-Vaccination-Trends-in-the-United-States-N/rh2h-3yt2
- Numbers for Flu vaccine doses administered for 2019-2020 season found here: https://www.cdc.gov/flu/fluvaxview/coverage-1920estimates.htm
- Numbers for FDA regulated drugs taken from FDA’s FAERS website, located here: https://www.fda.gov/drugs/questions-and-answers-fdas-adverse-event-reporting-system-faers/fda-adverse-event-reporting-system-faers-public-dashboard
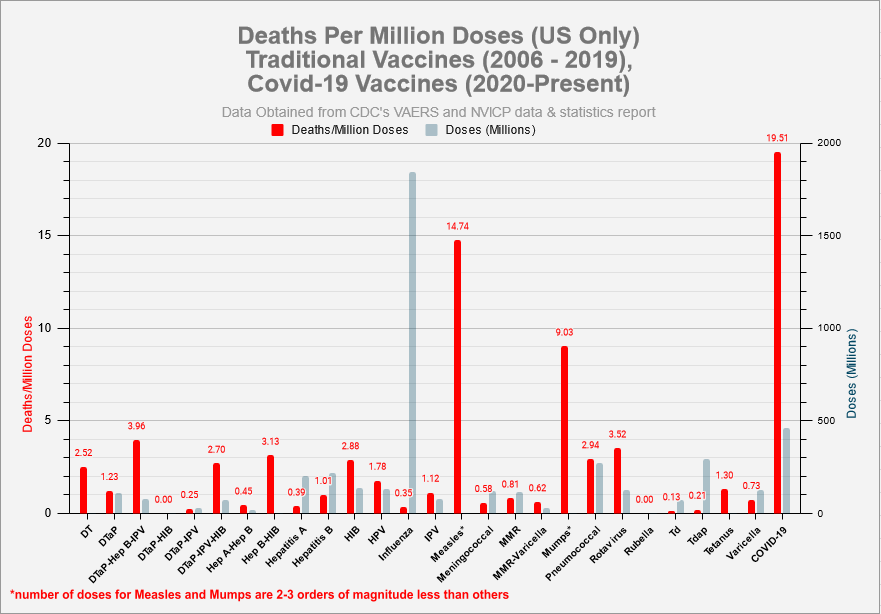
[…] only does this vaccine not work, but it is also the most deadly vaccine ever produced. The VAERS database has recorded over 19k deaths due to the COVID […]
[…] (vaccine adverse event reporting database) compiled by the World Health Organization has revealed the experimental COVID vaccines are the most deadly vaccines in all of vaccine history. The number of deaths from the COVID vaccines top even the deadly measles vaccine, which previously […]
[…] VAERS Summary for COVID-19 Vaccines through 11/26/2021 […]
Hi,
Thank you so much for this website!!! The WONDER searches I have done were befuddling and the data download was hard work (and, even, blocked Monday when I tried this last).
Could you possibly run deaths and incidents set of reports that show, say, the rolling last 12 months? It seems that the percentages have improved considerably — although the message is still basically the same. I don’t know why this seems to have dropped (your ideas are welcome), but I want to avoid making arguments or decisions based on “ancient history” or start-up problems.
Thank you,
Lee
Awesome job putting this reference together! I’ve already used it many times to keep my friends abreast as to what’s really going on out there. Keep up the good work! Question: I just read an article saying J&J jabs were responsible from numerous cases of Guillan-Barre. Is there an existing chart on this site that compares the incidents of specific Adverse Events by vaccine manufacturer?
The CDC is very concerned about vaccine hesitancy, so it didn’t want to suspend usage of the J&J vaccine, which would cause more people to lose confidence with getting vaxxed. 61 page doc from Dec 16 (2 weeks ago). https://www.cdc.gov/vaccines/acip/meetings/downloads/slides-2021-12-16/04_COVID_Oliver_2021-12-16.pdf
The original Jul referenced study link: https://www.cdc.gov/mmwr/volumes/70/wr/mm7032e4.htm?s_cid=mm7032e4_w
[…] reactions, some of those serious. With almost 930,000 adverse reactions worldwide and almost 20,000 deaths from the Covid vaccines, it seems irrational that we are not pulling the vaccines from the […]