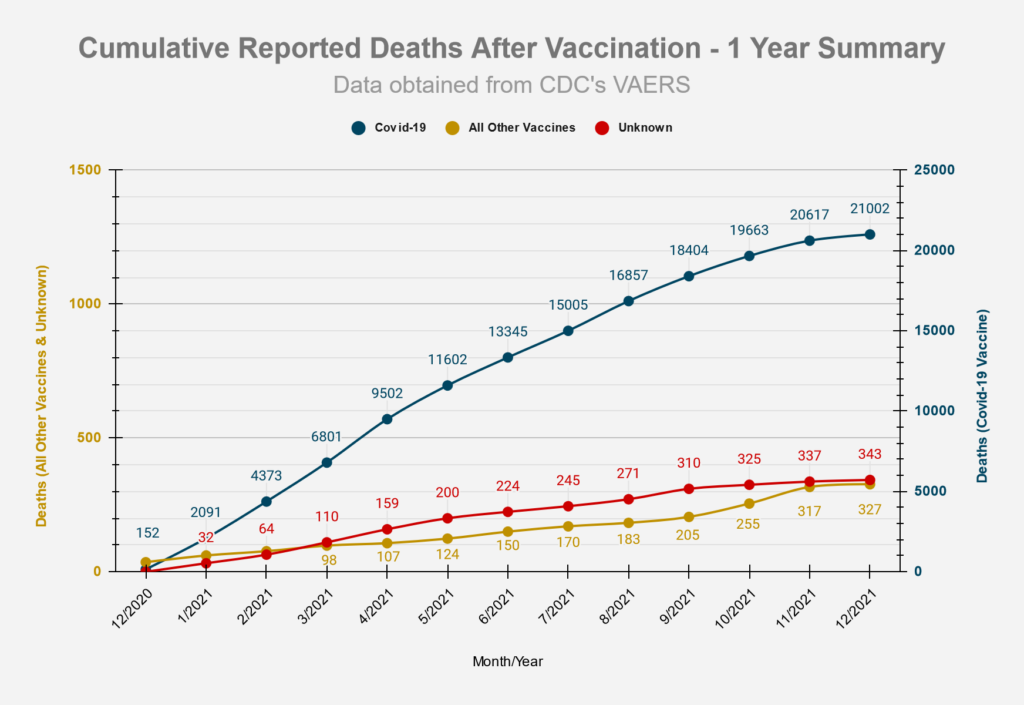
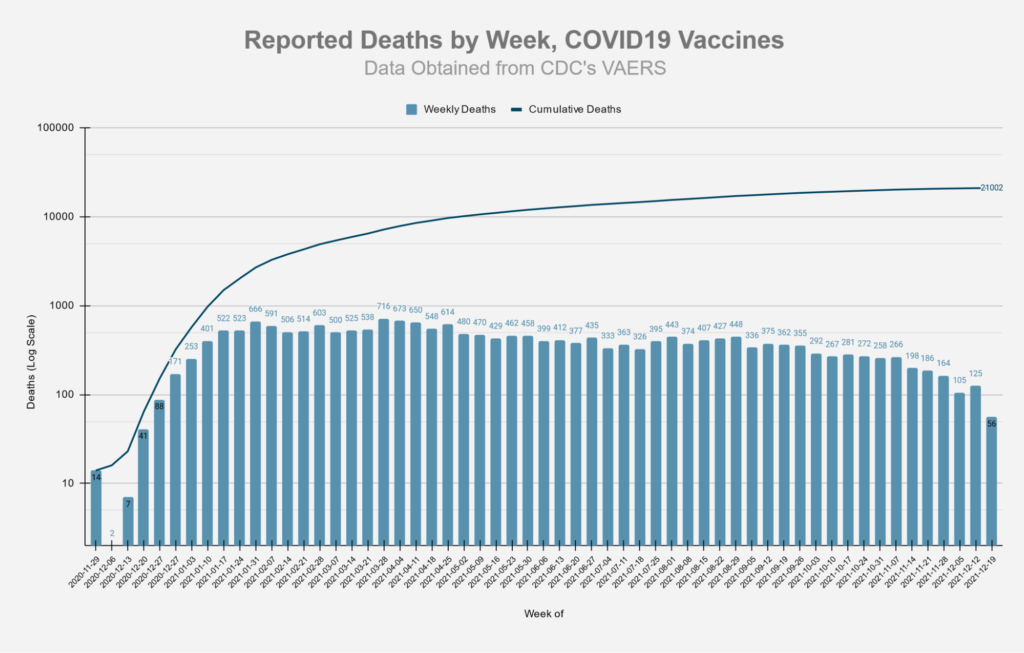
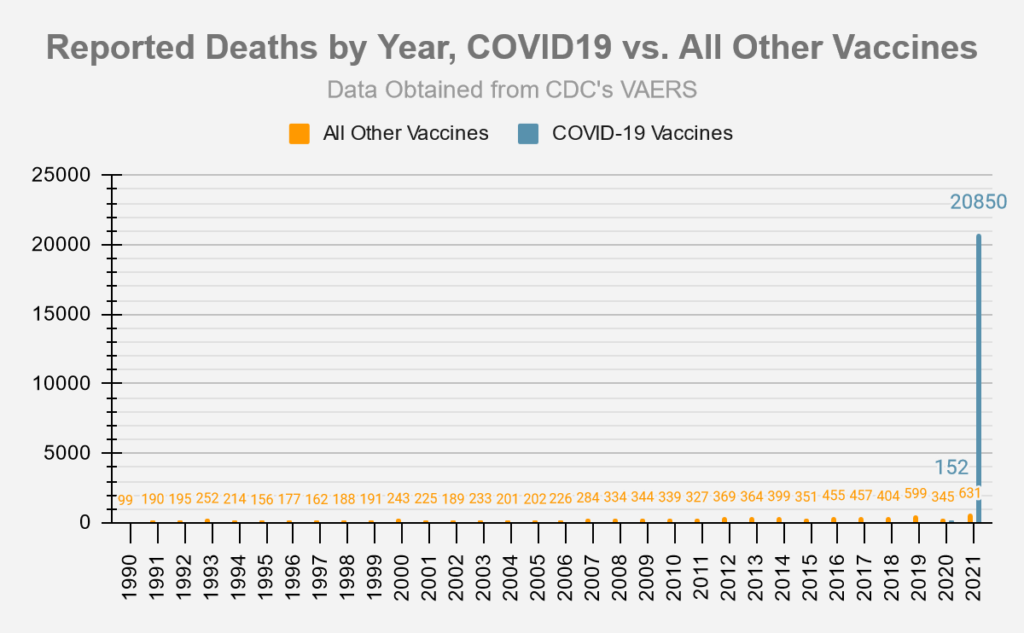
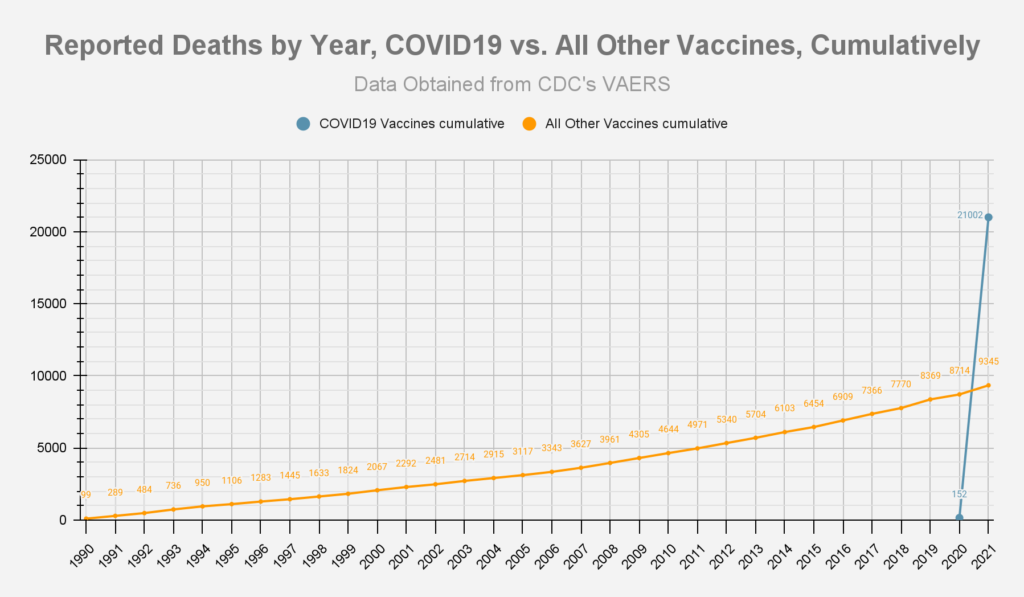
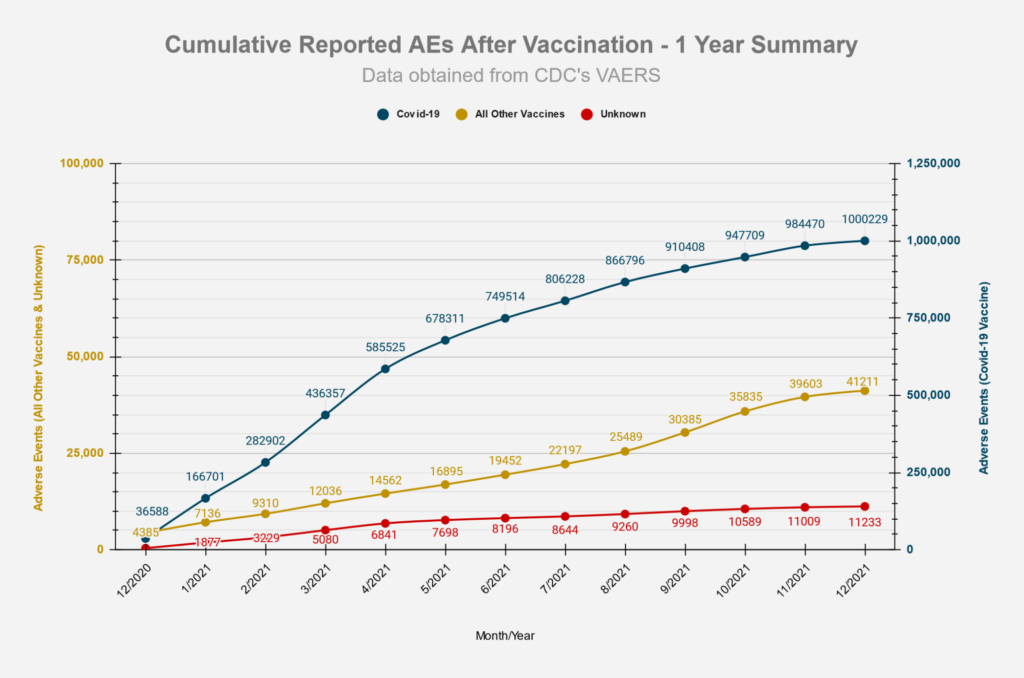
All charts and tables below reflect the data release on 12/31/2021 from the VAERS website, which includes U.S. and foreign data, and is updated through: 12/24/2021
| High-Level Summary | COVID19 vaccines (Dec’2020 – present) | All other vaccines 1990-present | US Data Only COVID19 vaccines (Dec’2020 – present) | US Data Only All other vaccines 1990-present |
|---|---|---|---|---|
| Number of Adverse Reactions | 1,000,229 | 865,684 | 709,084 | 753,663 |
| Number of Life-Threatening Events | 23,891 | 14,292 | 10,951 | 9,891 |
| Number of Hospitalizations | 110,609 | 82,661 | 45,960 | 38,744 |
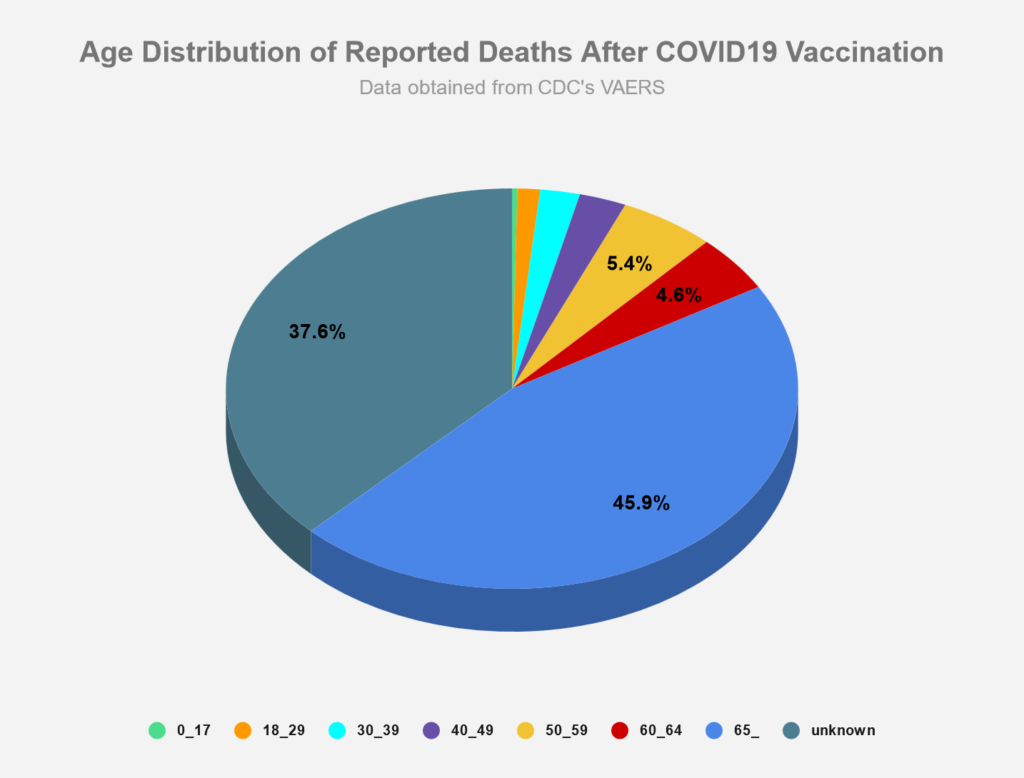
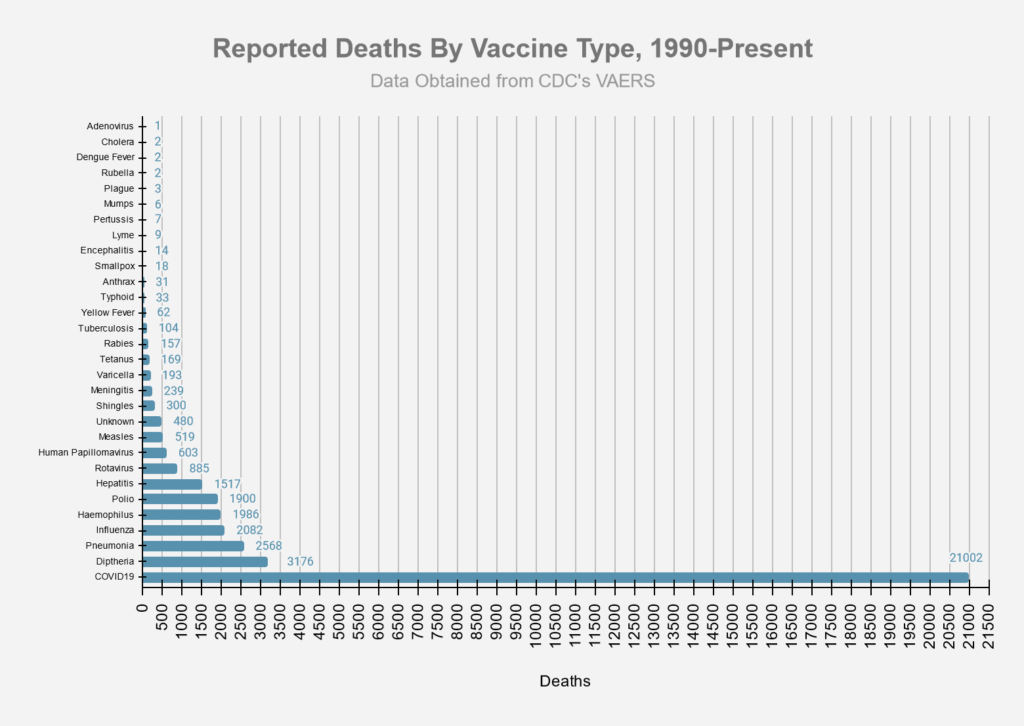
| Number of Deaths | 21,002* | 9,434* | 9,623 | 5,228 |
| # of Permanent Disabilities after vaccination | 35,650 | 20,635 | 11,255 | 12,769 |
| Number of Office Visits | 156,455 | 49,068 | 137,817 | 46,985 |
| # of Emergency Room/Department Visits | 109,164 | 212,286 | 88,116 | 202,817 |
| # of Birth Defects after vaccination | 764 | 188 | 428 | 102 |
Deaths

Adverse Events
Symptoms
The slide below was taken from an FDA document from October 22, 2020 and provides a list of possible adverse event outcomes related to the Covid-19 vaccines.
- Source: ‘Vaccines and Related Biological Products Advisory Committee October 22,2020 Meeting Presentation”.
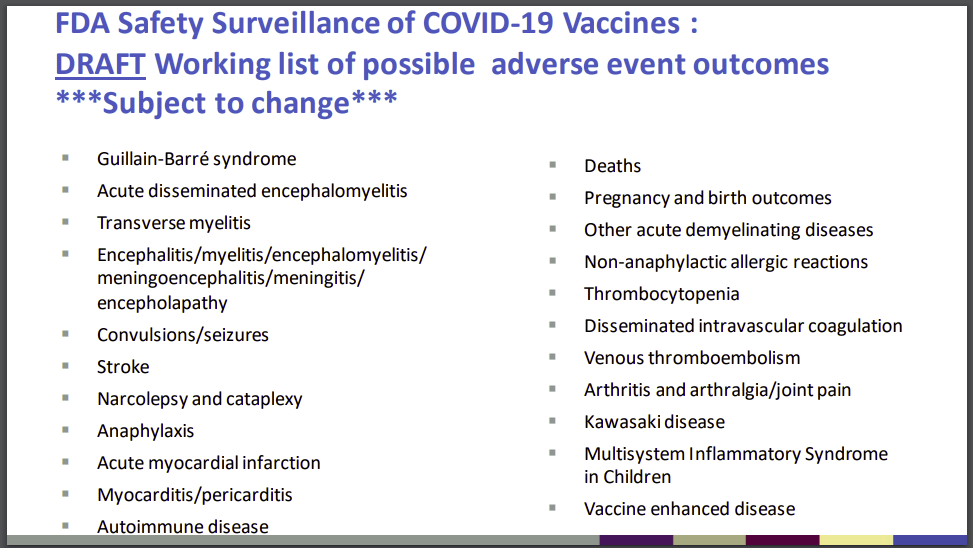
The following table lists the number of adverse events found in the VAERS data which match the outcomes listed above:
| FDA Listed Symptom | Total (Non-Lethal) Adverse Events | Total Deaths |
|---|---|---|
| Guillain-Barre | 1988 | 34 |
| Acute Disseminated Encephalomyelitis | 148 | 4 |
| Transverse Myelitis | 353 | 2 |
| Encephalitis | 1659 | 166 |
| Convulsions/Seizures | 12691 | 363 |
| Stroke | 11975 | 1078 |
| Narcolepsy, Cataplexy | 245 | 5 |
| Anaphylaxis | 42429 | 163 |
| Acute Myocardial Infarction (Heart Attack) | 3583 | 1071 |
| Myocarditis/Pericarditis | 14673 | 177 |
| Autoimmune Disease | 1171 | 22 |
| Other Acute Demyelinating Diseases | 266 | 3 |
| Pregnancy and birth outcomes (Miscarriages) | 3235 | 102 |
| Other Allergic Reactions | 1875 | 3 |
| Thrombocytopenia | 4355 | 321 |
| Disseminated Intravascular Coagulation | 190 | 60 |
| Venous Thromboembolism | 18597 | 1035 |
| Arthritis and Arthralgia/Joint Pain | 65128 | 194 |
| Kawasaki Disease | 62 | 1 |
| Systemic Inflammatory Response Syndrome | 604 | 46 |
Vaccination Related Risks of COVID19 Vs. Flu
These set of figures compare the COVID19 vaccine to the traditional Flu vaccines. ‘Risk of Death’ percentages depend on the ‘# of Vaccinations’ data, which is only approximate, and was pulled from the CDC’s report on Flu vaccination coverage for the 2019-2020 season, and from Our World in Data for the COVID19 vaccinations.
Covid19 vaccinations through 5/31/2021 vs. Flu vaccinations 7/1/2019 – 5/31/2020 (last complete flu season)
| Vaccine Type | # of Vaccinations[3] | # of Deaths | Risk of Death | Percentage | Deaths/Mill. Vaccinations[3] |
|---|---|---|---|---|---|
| Flu | 167,447,642[1] | 33 | 1 in 5,074,171 | 0.000020% | .20 |
| COVID19 | 167,733,972[2] | 5,618 | 1 in 29,857 | 0.003349% | 33.49 |
| Vaccine Type | # of Vaccinations[3] | # of Adverse Reactions | Risk of Adverse Reaction | Percentage | AEs/Mill. Vaccinations[3] |
|---|---|---|---|---|---|
| Flu | 167,447,642 | 9,713 | 1 in 17,240 | 0.005801% | 58.01 |
| COVID19 | 167,733,972 | 538,152 | 1 in 312 | 0.3208% | 3,208 |
[1] number of flu vaccinations based on estimated flu vaccine coverage data from CDC and estimated population data from US Census. Yearly flu vaccination data covers a period of time from 7/1 to 5/31 of the following year.
[2] number of covid19 vaccinations based on estimates from Our World in Data [2] number of covid19 vaccinations based on estimates from Our World in Data
[3] Persons vaccinated with at least one dose.
Vaccine Data by Manufacturer
| Manufacturer | # of Deaths | % Deaths | Average Deaths/Day | # US Deaths | US Doses Administered | Average US Deaths/Mill. Doses | Days since EUA approval | EUA Approval Date- |
|---|---|---|---|---|---|---|---|---|
| Janssen (JNJ) | 1796 | 8.55% | 5.97 | 1156 | 17,613,846 | 65.63 | 301 | 2/26/2021 |
| Moderna | 5146 | 24.48% | 13.87 | 4015 | 193,650,993 | 20.79 | 371 | 12/18/2020 |
| Pfizer/Biontech | 13985 | 66.54% | 37 | 4420 | 295,858,234 | 14.94 | 378 | 12/11/2020 |
| Unknown | 91 | 0.43% | 40 | 534,907 |
| Manufacturer | # of AEs | % AEs | Average AEs/Day | # US AEs | US Doses Administered | Average US AEs/Mill. Doses | Days since EUA approval | EUA Approval Date |
|---|---|---|---|---|---|---|---|---|
| Janssen (JNJ) | 73767 | 7.36% | 245.07 | 63225 | 17,613,846 | 3589.51 | 301 | 2/26/2021 |
| Moderna | 366575 | 36.59% | 998.07 | 326416 | 193,650,993 | 1685.59 | 371 | 12/18/2020 |
| Pfizer/Biontech | 559199 | 55.81% | 1479.36 | 319102 | 295,858,234 | 1078.56 | 378 | 12/11/2020 |
| Unknown | 2378 | 0.24% | 1586 | 534,907 |
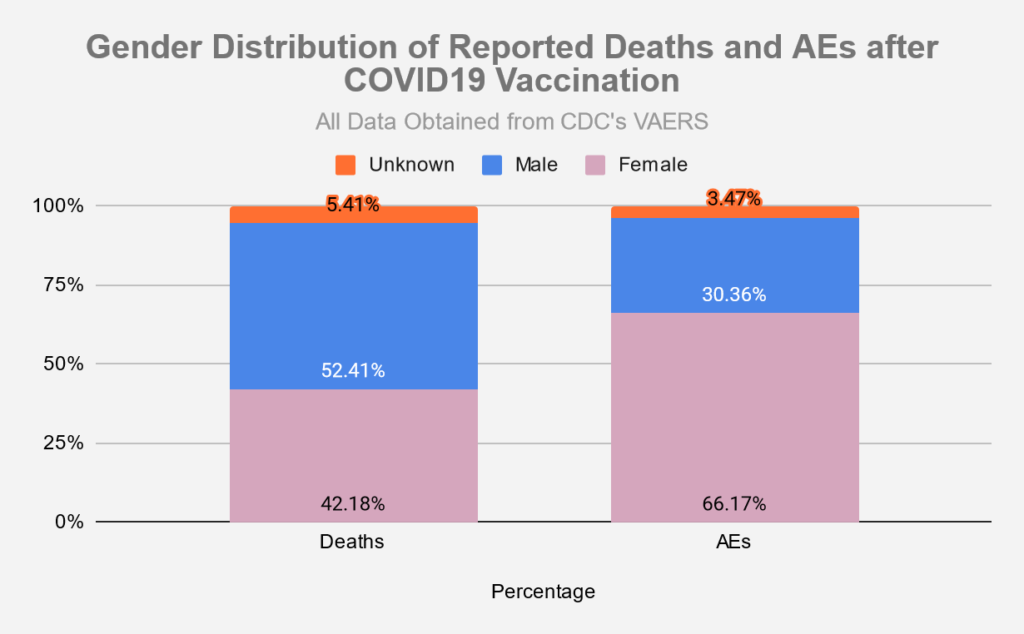
Vaccine Data by Gender
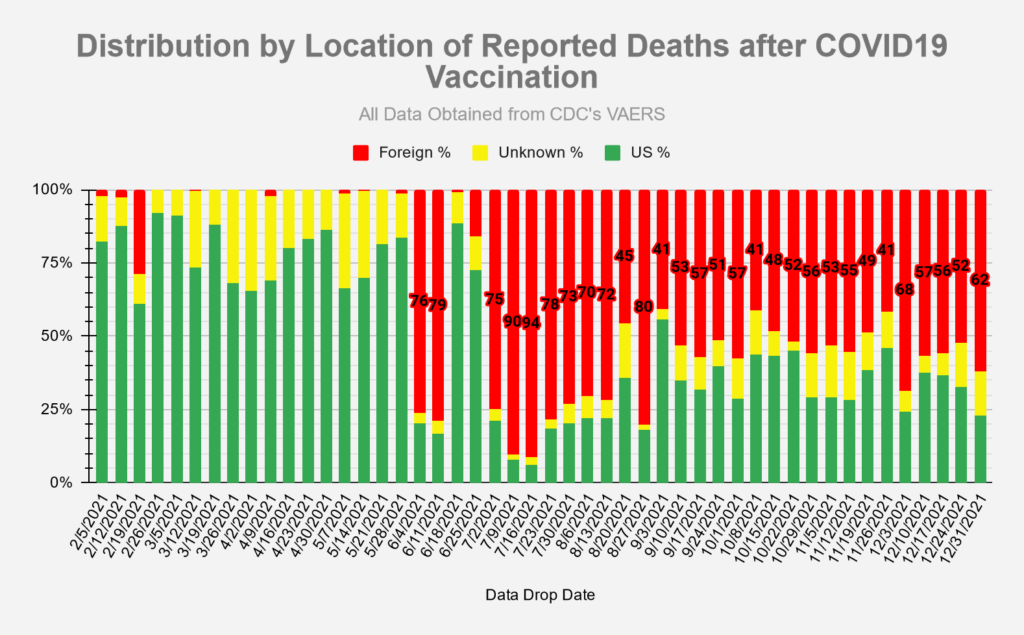
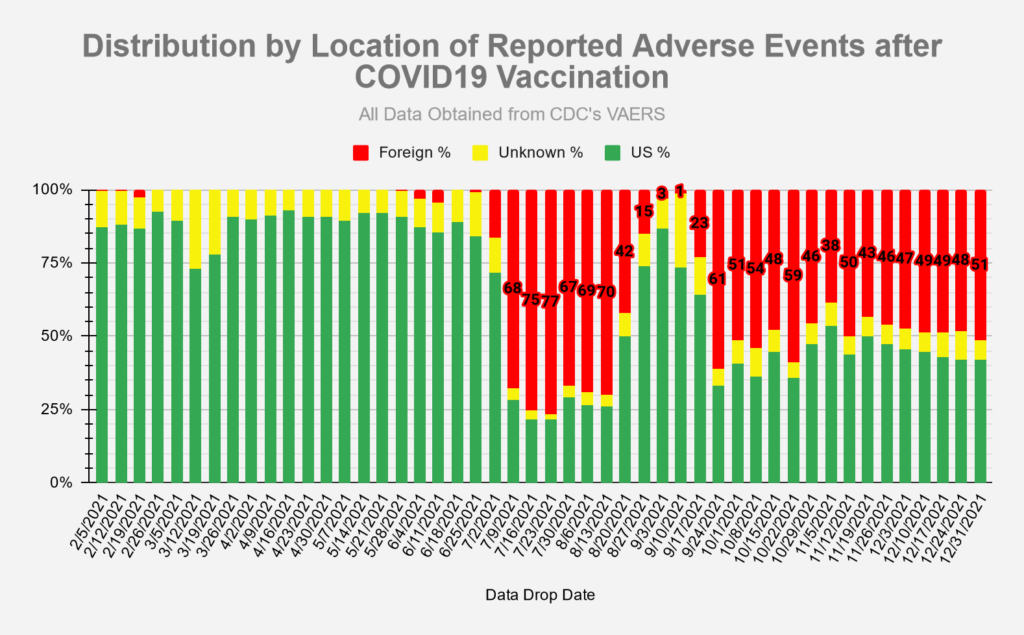
Vaccine Data by Location
Recall History
Sources
- Vaccine data (Covid-19 and other vaccines) taken from CDC’s VAERS website, located here: https://vaers.hhs.gov/data/datasets.html. VAERS data sets in the form of csv files are pulled down weekly and put into a database for reporting/analysis. Data files are available all the way back to 1990.
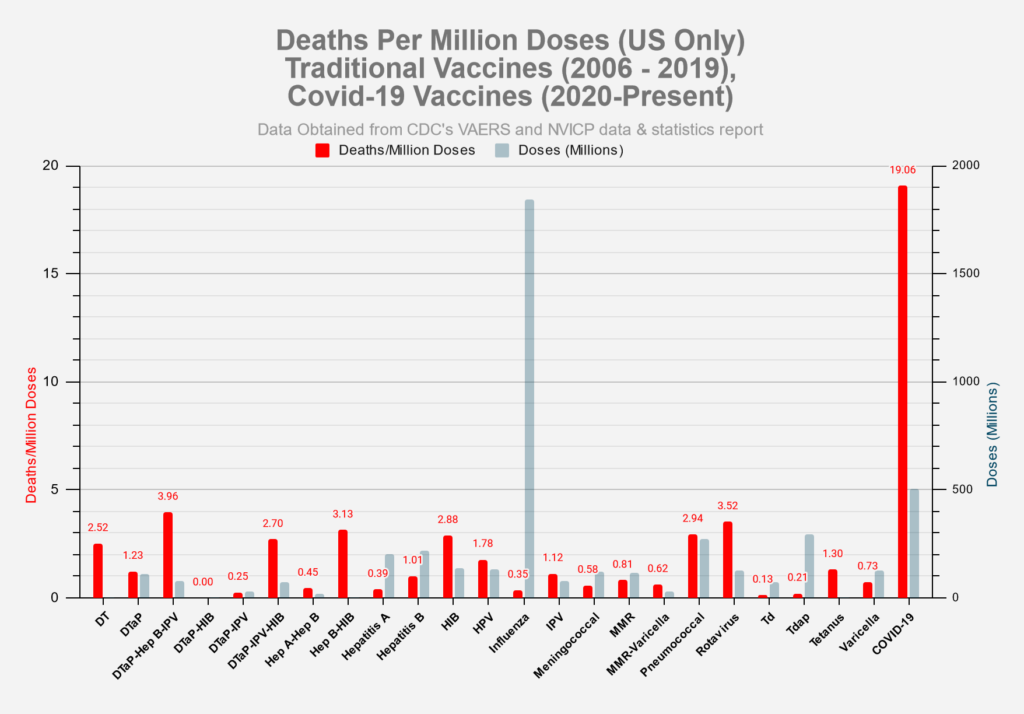
- Number of doses distributed for other vaccines found in NVICP Data and Statistics report here: https://www.hrsa.gov/sites/default/files/hrsa/vaccine-compensation/data/data-statistics-report.pdf
- Numbers for Covid-19 vaccines administered by manufacturer found here: https://covid.cdc.gov/covid-data-tracker/#vaccinations_vacc-total-admin-rate-total
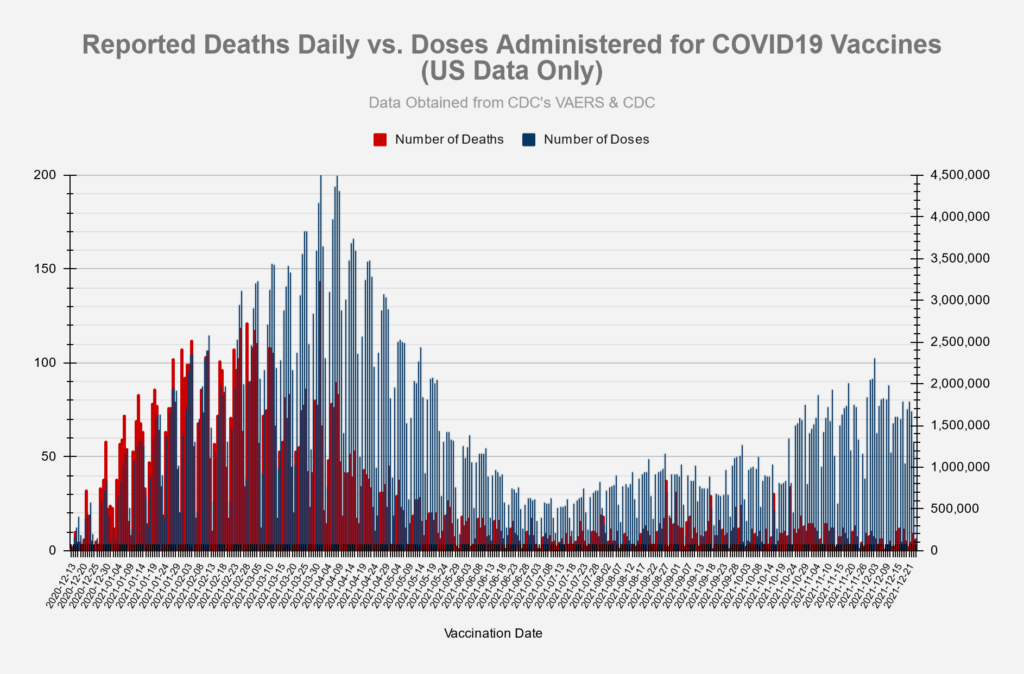
- Numbers for total Covid-19 vaccine doses administered found here: https://data.cdc.gov/Vaccinations/COVID-19-Vaccination-Trends-in-the-United-States-N/rh2h-3yt2
- Numbers for Flu vaccine doses administered for 2019-2020 season found here: https://www.cdc.gov/flu/fluvaxview/coverage-1920estimates.htm
- Numbers for FDA regulated drugs taken from FDA’s FAERS website, located here: https://www.fda.gov/drugs/questions-and-answers-fdas-adverse-event-reporting-system-faers/fda-adverse-event-reporting-system-faers-public-dashboard
[…] of Covid vaccine deaths. She sourced the information from the government’s own database, the Vaccine Adverse Event Reporting System (VAERS) (PDF […]
Just posted on the CDC website, “ COVID-19 Science Update” that actually looks like science and not political posturing. https://www.cdc.gov/library/covid19/12172021_covidupdate.html
The CDC is finally admitting that natural immunity (key words alert) REGARDLESS OF VACCINATION STATUS is more effective than full vaccination. Also, they stated that someone who never had covid, but was vaccinated has a 41 fold chance? of getting omicron variant.
[…] VAERS Summary for COVID-19 Vaccines through 12/24/2021 Posted in Uncategorized […]
Hello, A huge thank you for the time you give for this synthesis work. Its the same in France, its self-employed volunteers who synthesize the data scattered on the Government’s websites.Do you allow me to share your website ? I send you full of love and gratitude. Stay free. All my best wishes for this new year.
https://www.data-like.com/
Sure, share away Patrick!
Does the Eurovigilence numbers include the US or is it onlyEurope? It is so much higher than the US Vaers alone. AstraZeneca at 420,000,is not being administered in the US, but excluding those, the total is still greater than the US.
Hello, Sorry for the late reply, there’s only European Union data on Eurovigilence. The procedures are complicated and there is a lot of denial, so the figures are largely underestimated. All the best.
[…] La source des données est indiqué sur le site https://vaersanalysis.info/2021/12/31/vaers-summary-for-covid-19-vaccines-through-12-24-2021/ […]
[…] with all other vaccines combined since the year 1990," concludes vaersanalysis.info, which compiles VAERS data in a more user-friendly way. This is no ordinary vaccine that Biden and his minions are imposing on the American people for the […]
[…] other vaccines combined since the year 1990,” concludes vaersanalysis.info, which compiles VAERS data in a more user-friendly way. This is no ordinary vaccine that Biden and his minions are imposing on the American people for the […]
[…] other vaccines combined since the year 1990,” concludes vaersanalysis.info, which compiles VAERS data in a more user-friendly way. This is no ordinary vaccine that Biden and his minions are imposing on the American people for the […]
[…] other vaccines combined since the year 1990,” concludes vaersanalysis.info, which compiles VAERS data in a more user-friendly way. This is no ordinary vaccine that Biden and his minions are imposing on the American people for the […]
[…] all other vaccines combined since the year 1990,” concludes vaersanalysis.info, which compiles VAERS data in a more user-friendly way. This is no ordinary vaccine that Biden and his minions are imposing on the American people for the […]
Interesting article on a new cryptocurrency “Fucvax.” https://dailygazette.com/2022/01/05/new-canajoharie-town-supervisor-creates-cryptocurrency-protesting-vaccine-mandates/
Canada is giving informed consent to recipients of covid vaccine.
https://covid-vaccine.canada.ca/info/pdf/pfizer-biontech-covid-19-vaccine-pm1-en.pdf
Lists all early studies, very high number of fevers and use of pain medications.
In the US, recipients have to sign a consent form for vaccination, but are not given the actual contraindictions notice. There are 2 versions, one for the provider and one for the recipients.
[…] שלנו עם ח"כ רוטמן בטוויטרדאשבורד משרד הבריאותסיכום נתוני בטיחות ממערכת VAERSח"כ רוטמן מול ח"כ בגין בוועדת החוקה – הגבלות […]
[…] SOURCE – […]
[…] other vaccines combined since the year 1990,” concludes vaersanalysis.info, which compiles VAERS data in a more user-friendly way. This is no ordinary vaccine that Biden and his minions are imposing on the American people for the […]