All charts and tables below reflect the data release on 7/30/2021 from the VAERS website, which includes U.S. and foreign data, and is updated through: 7/23/2021
| High-Level Summary | COVID19 vaccines (Dec’2020 – present) | All other vaccines 1990-present |
|---|---|---|
| Number of Adverse Reactions | 518,770 | 810,792 |
| Number of Life-Threatening Events | 11,198 | 13,348 |
| Number of Hospitalizations | 40,991 | 77,498 |
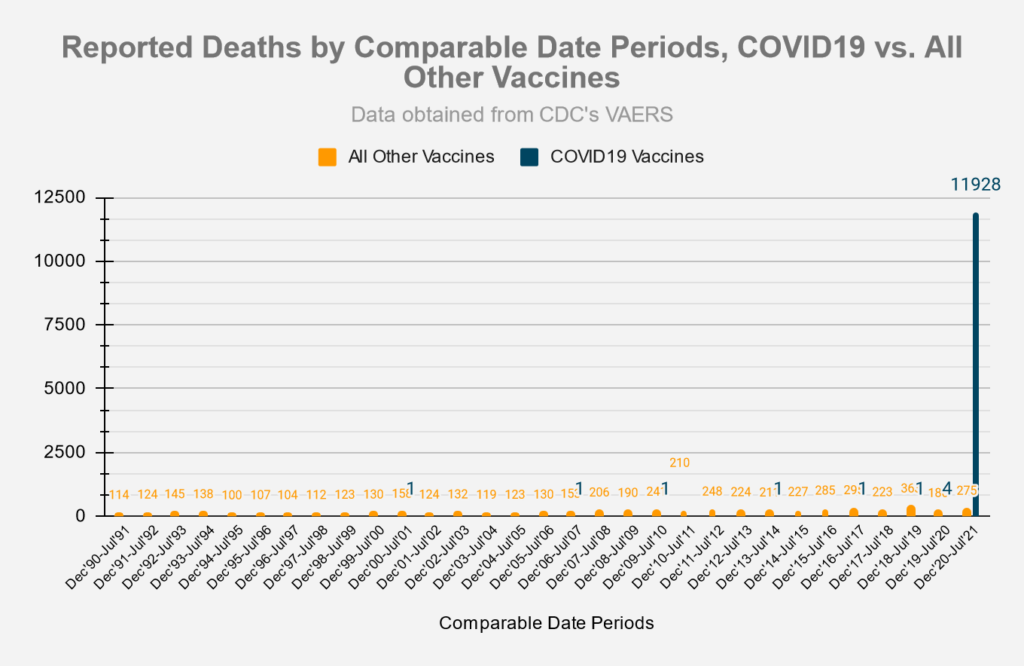
| Number of Deaths | 11,940* | 8,850 |
| # of Permanent Disabilities after vaccination | 12,808 | 18,911 |
| Number of Office Visits | 89,101 | 41,727 |
| # of Emergency Room/Department Visits | 65,216 | 208,711 |
| # of Birth Defects after vaccination | 307 | 133 |
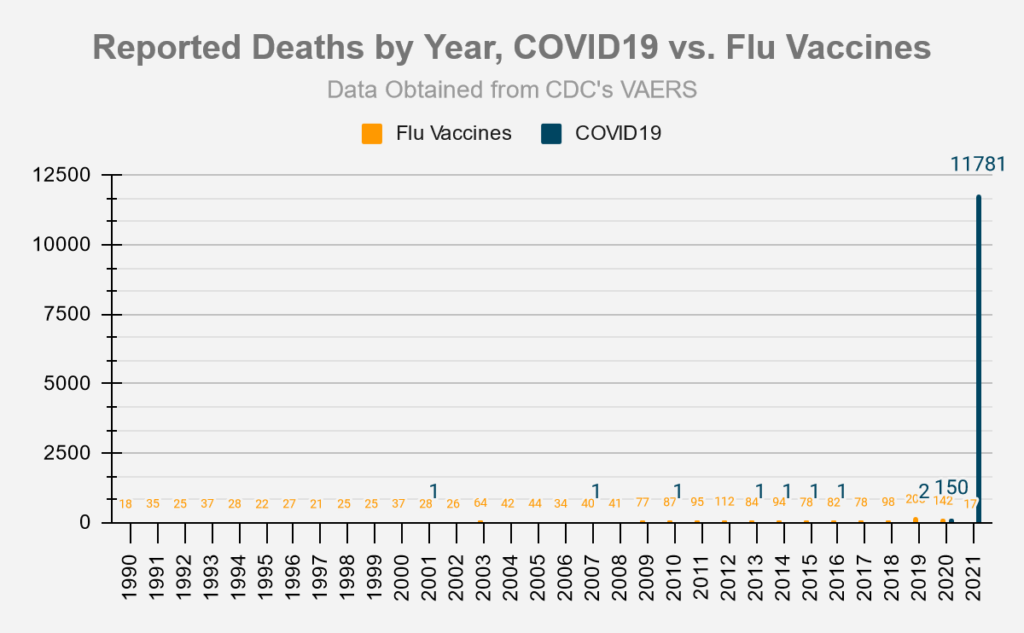
Deaths
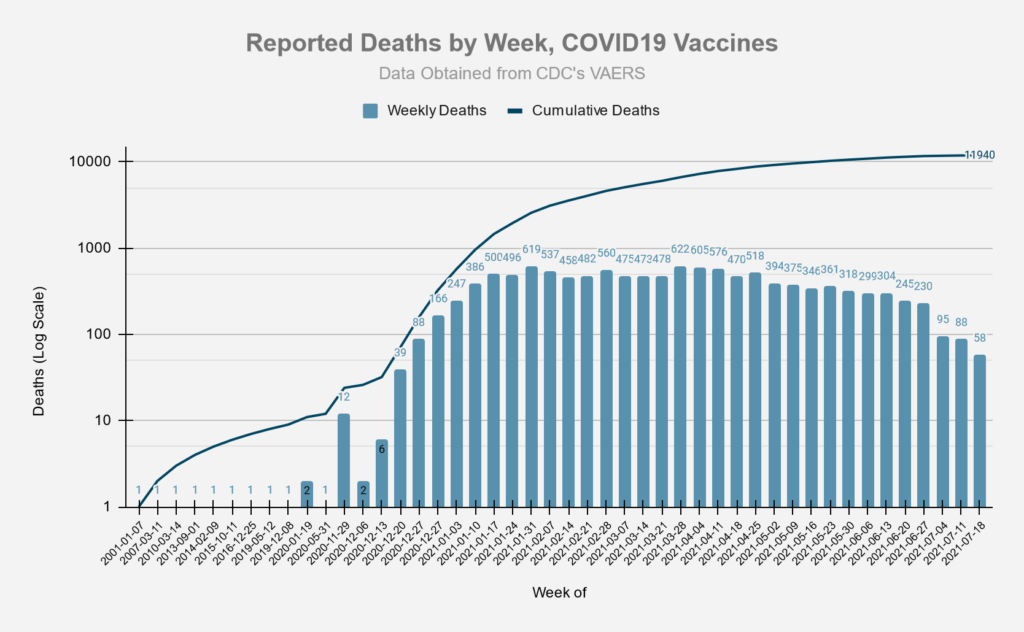


Chart using comparable 8 month periods, since Covid-19 vaccines have only been available for approximately 8 months:


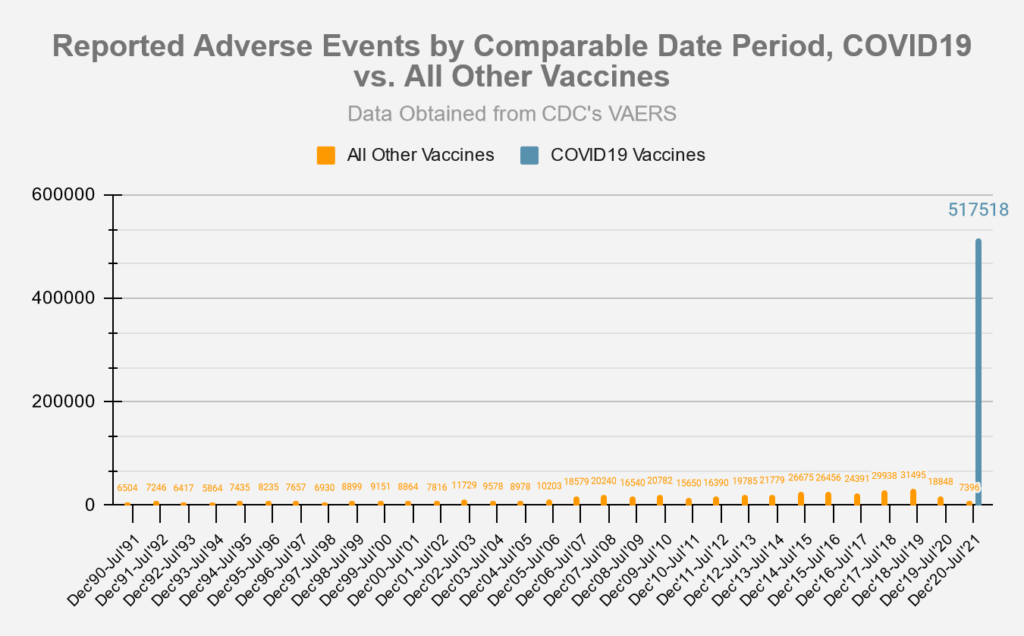
Adverse Events
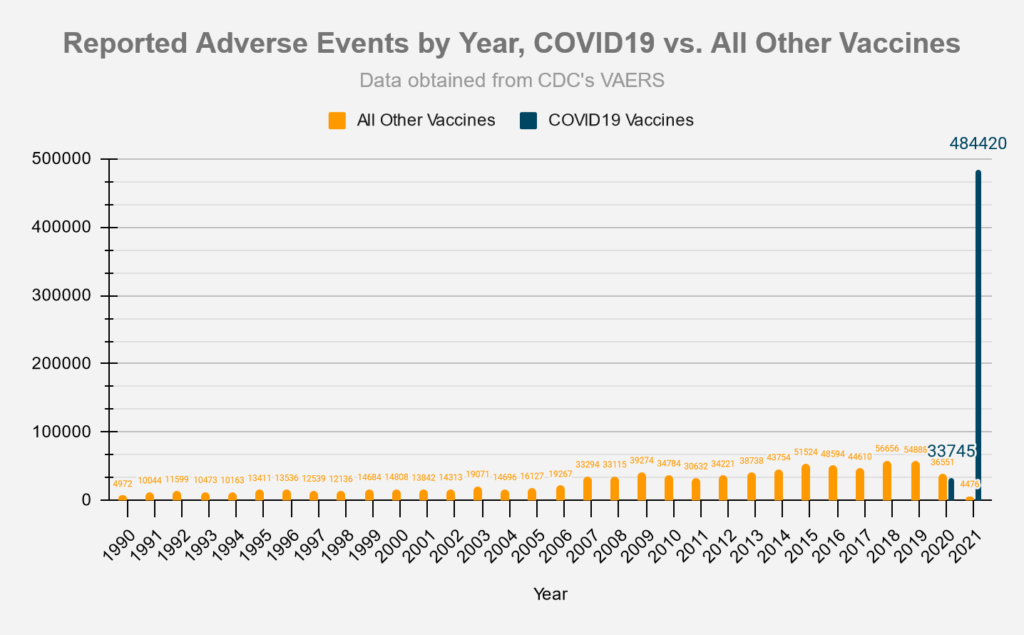
Chart using comparable 8 month periods, since Covid-19 vaccines have only been available for approximately 8 months:
Symptoms
The slide below was taken from an FDA document from October 22, 2020 and provides a list of possible adverse event outcomes related to the Covid-19 vaccines.
- Source: ‘Vaccines and Related Biological Products Advisory Committee October 22,2020 Meeting Presentation”.
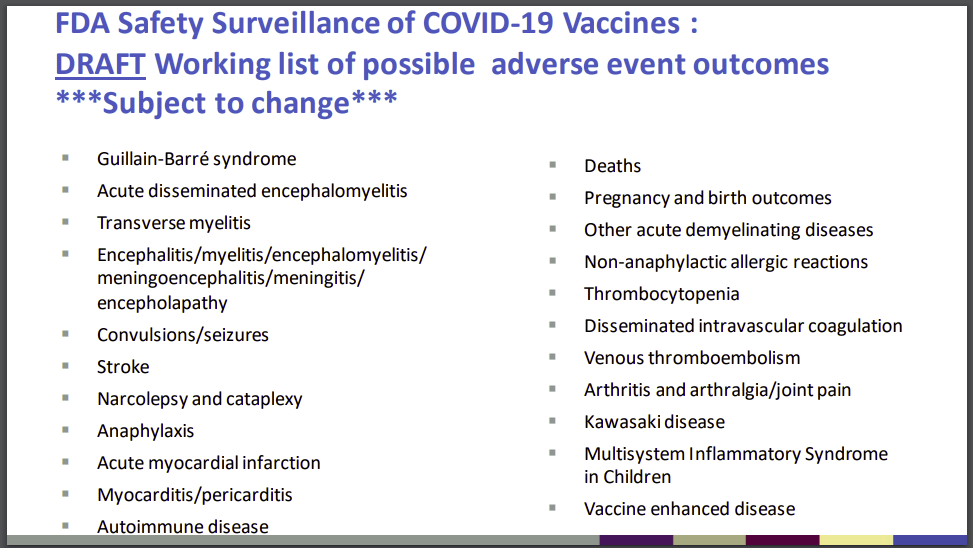
The following table lists the number of adverse events found in the VAERS data which match the outcomes listed above:
| FDA Listed Symptom | Total (Non-Lethal) Adverse Events | Total Deaths |
|---|---|---|
| Guillain-Barre | 646 | 15 |
| Acute Disseminated Encephalomyelitis | 44 | 1 |
| Transverse Myelitis | 174 | 0 |
| Encephalitis | 581 | 69 |
| Convulsions/Seizures | 6453 | 214 |
| Stroke | 5962 | 685 |
| Narcolepsy, Cataplexy | 96 | 2 |
| Anaphylaxis | 25244 | 113 |
| Acute Myocardial Infarction (Heart Attack) | 1521 | 621 |
| Myocarditis/Pericarditis | 2571 | 42 |
| Autoimmune Disease | 396 | 12 |
| Other Acute Demyelinating Diseases | 93 | 1 |
| Pregnancy and birth outcomes (Miscarriages) | 1239 | 31 |
| Other Allergic Reactions | 845 | 0 |
| Thrombocytopenia | 1592 | 164 |
| Disseminated Intravascular Coagulation | 70 | 30 |
| Venous Thromboembolism | 8036 | 533 |
| Arthritis and Arthralgia/Joint Pain | 34754 | 99 |
| Kawasaki Disease | 22 | 0 |
| Systemic Inflammatory Response Syndrome | 273 | 15 |
Vaccination Related Risks of COVID19 Vs. Flu
These set of figures compare the COVID19 vaccine to the traditional Flu vaccines. ‘Risk of Death’ percentages depend on the ‘# of Vaccinations’ data, which is only approximate, and was pulled from the CDC’s report on Flu vaccination coverage for the 2019-2020 season, and from Our World in Data for the COVID19 vaccinations.
Covid19 vaccinations through 5/31/2021 vs. Flu vaccinations 7/1/2019 – 5/31/2020 (last complete flu season)
| Vaccine Type | # of Vaccinations | # of Deaths | Risk of Death | Percentage |
|---|---|---|---|---|
| Flu | 167,447,642[1] | 91 | 1 in 1,840,083 | 0.000054% |
| COVID19 | 167,733,972[2] | 10,369 | 1 in 16,176 | 0.006182% |
| Vaccine Type | # of Vaccinations | # of Adverse Reactions | Risk of Adverse Reaction | Percentage |
|---|---|---|---|---|
| Flu | 167,447,642 | 10,448 | 1 in 16,027 | 0.006231% |
| COVID19 | 167,733,972 | 489,582 | 1 in 342 | 0.2919% |
[1] number of flu vaccinations based on estimated flu vaccine coverage data from CDC and estimated population data from US Census. Yearly flu vaccination data covers a period of time from 7/1 to 5/31 of the following year.
[2] number of covid19 vaccinations based on estimates from Our World in Data
Vaccine Data by Manufacturer
| Manufacturer | # of Deaths | % Deaths | Average Deaths/Day | Days since EUA approval | EUA Approval Date- |
|---|---|---|---|---|---|
| Janssen (JNJ) | 635 | 5.32% | 4.32 | 147 | 2/26/2021 |
| Moderna | 3090 | 25.87% | 14.24 | 217 | 12/18/2020 |
| Pfizer/Biontech | 8185 | 68.52% | 36.54 | 224 | 12/11/2020 |
| Unknown | 36 | 0.3% |
| Manufacturer | # of Adverse Events | % AEs | Average AEs/Day | Days since EUA approval | EUA Approval Date |
|---|---|---|---|---|---|
| Janssen (JNJ) | 45688 | 8.8% | 310.8 | 147 | 2/26/2021 |
| Moderna | 198045 | 38.14% | 912.65 | 217 | 12/18/2020 |
| Pfizer/Biontech | 274331 | 52.84% | 1224.69 | 224 | 12/11/2020 |
| Unknown | 1153 | 0.22% |
Vaccine Data by Gender

Thank you for all the data and charts!! It’s very hard to pull this information on my own and analyze it.
Fantastic job every week! I saw your post on Bitchute that you felt like system being set up to be discredited. For at least six months I have spent many hours each week perusing VAERS data, on both the CDC wonder and Medalerts databases, making endless queries with different parameters, randomly selecting ID #’s to examine, searching ID #’s in between those shown etc., so I feel pretty familiar with the database and I think you’re exactly right! I got this feeling vaguely with 7/9 dump, increasing 7/16, with 7/23 confirming.A few red flags from my queries: Many entries with same date for Vax, onset, and entry. Different number result totals for same category but diff search query. Rapidly escalating unknowns in every category and ofc the foreign proliferation. Also noticed increasing variety of reporting entities (including ones referring to social media posts and to what sounded like info from personal emails) and many reports with far fewer details than previous records.