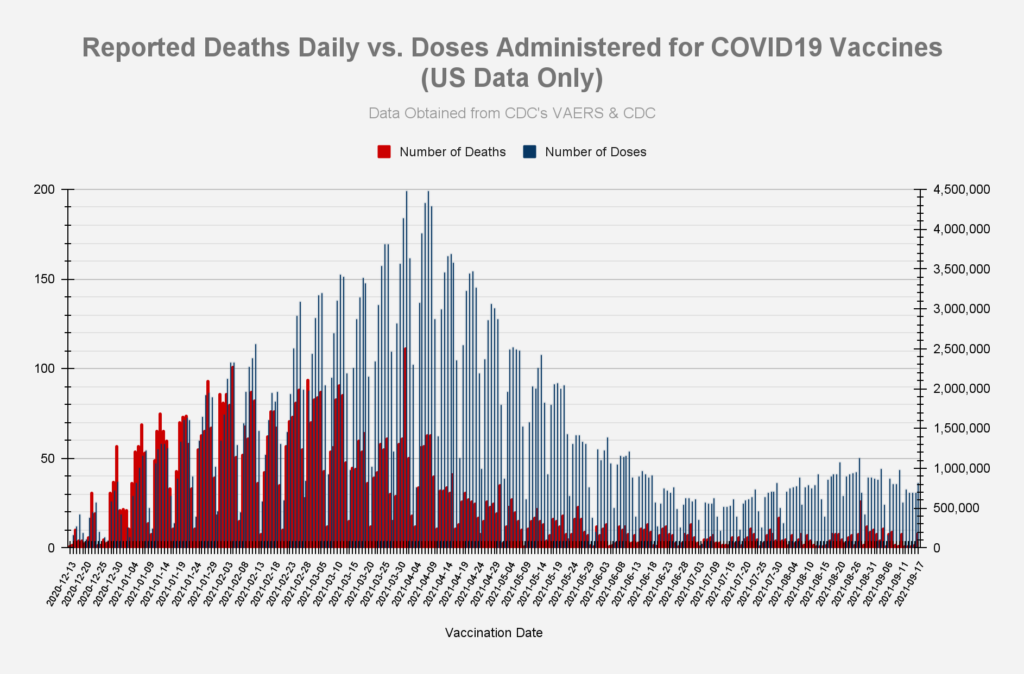
All charts and tables below reflect the data release on 9/24/2021 from the VAERS website, which includes U.S. and foreign data, and is updated through: 9/17/2021
| High-Level Summary | COVID19 vaccines (Dec’2020 – present) | All other vaccines 1990-present | US Data Only COVID19 vaccines (Dec’2020 – present) | US Data Only All other vaccines 1990-present |
|---|---|---|---|---|
| Number of Adverse Reactions | 726,965 | 821,800 | 569,294 | 720,923 |
| Number of Life-Threatening Events | 16,056 | 13,609 | 8,606 | 9,712 |
| Number of Hospitalizations | 66,642 | 78,471 | 32,612 | 38,158 |
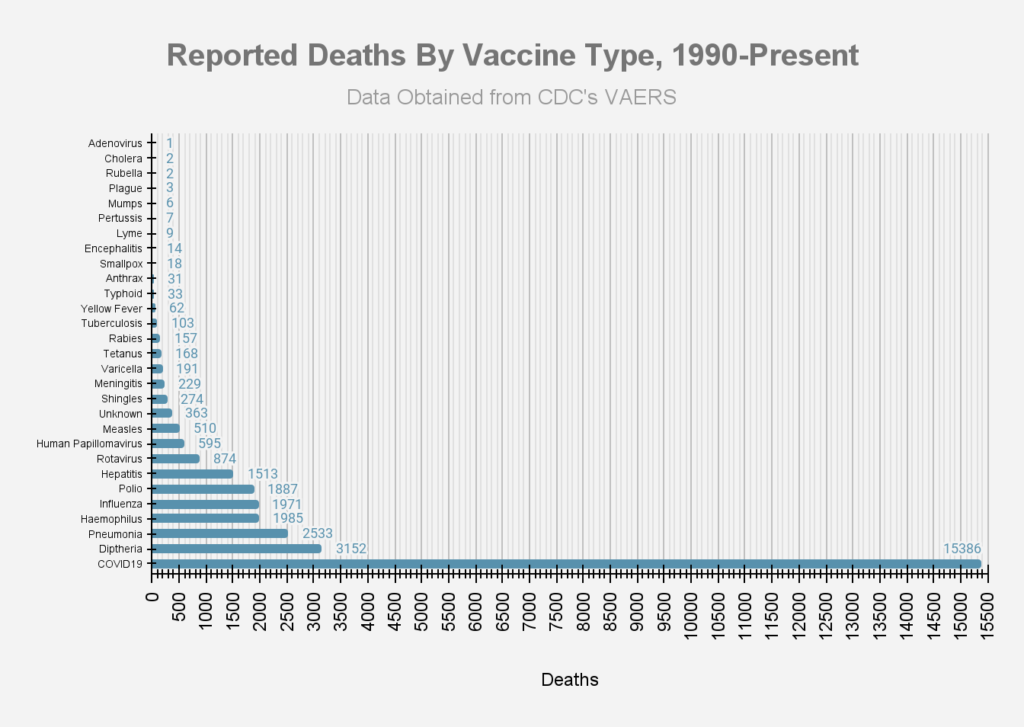
| Number of Deaths | 15,386* | 9,104 | 6,981 | 5,115 |
| # of Permanent Disabilities after vaccination | 20,789 | 19,607 | 8,088 | 12,445 |
| Number of Office Visits | 114,126 | 43,187 | 106,281 | 41,874 |
| # of Emergency Room/Department Visits | 82,798 | 209,732 | 71,490 | 200,771 |
| # of Birth Defects after vaccination | 475 | 139 | 311 | 89 |
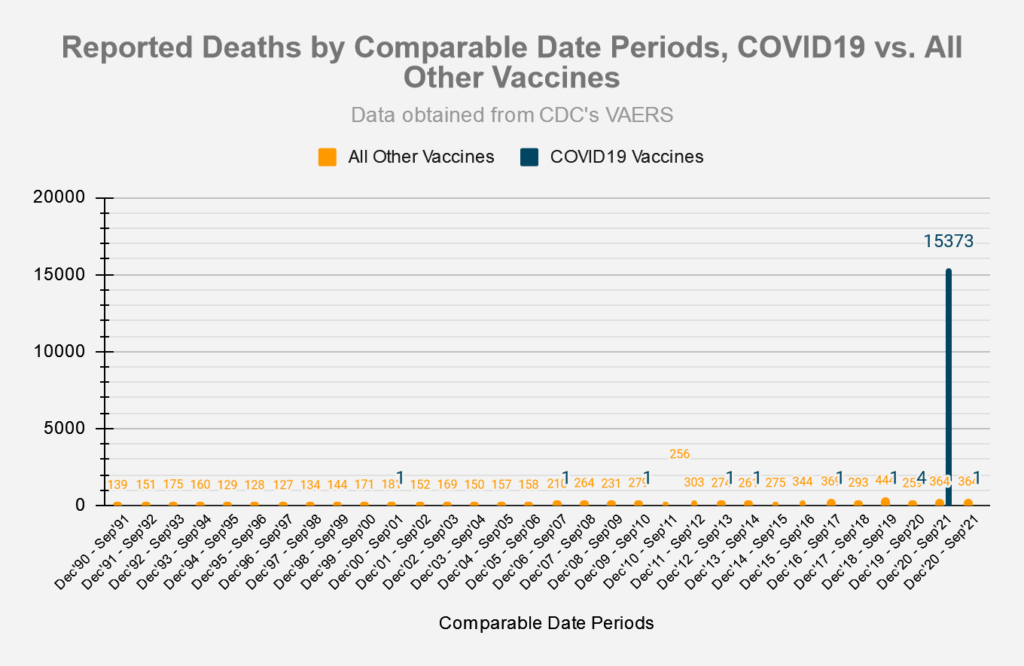
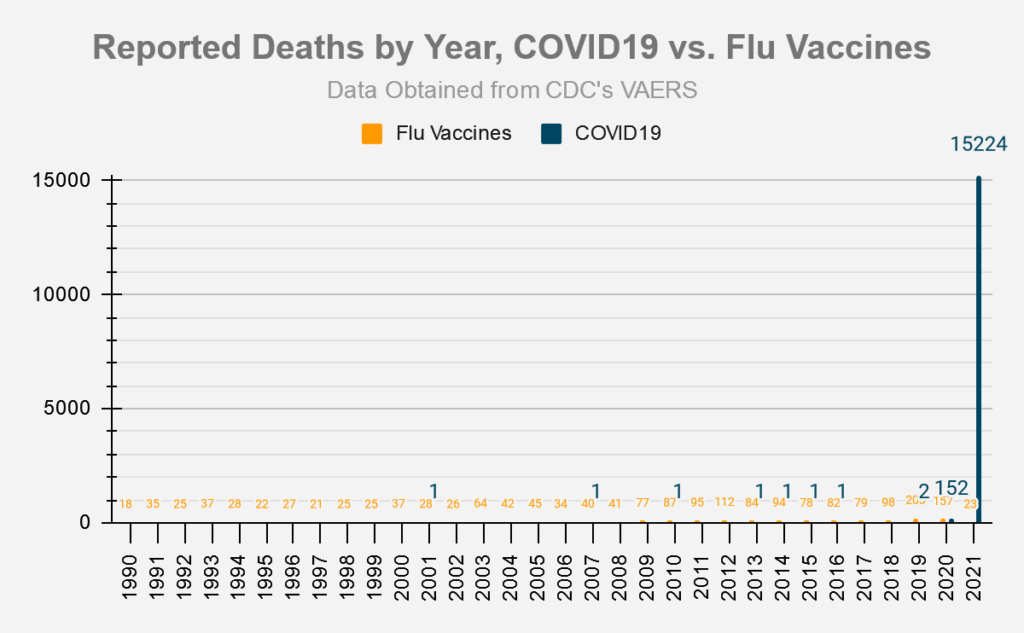
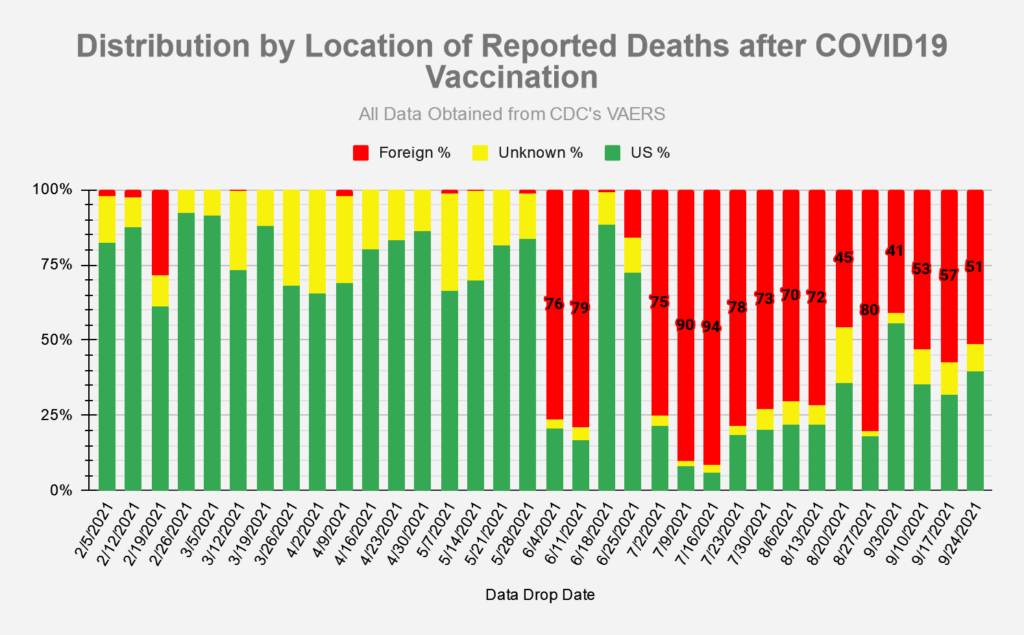
Deaths
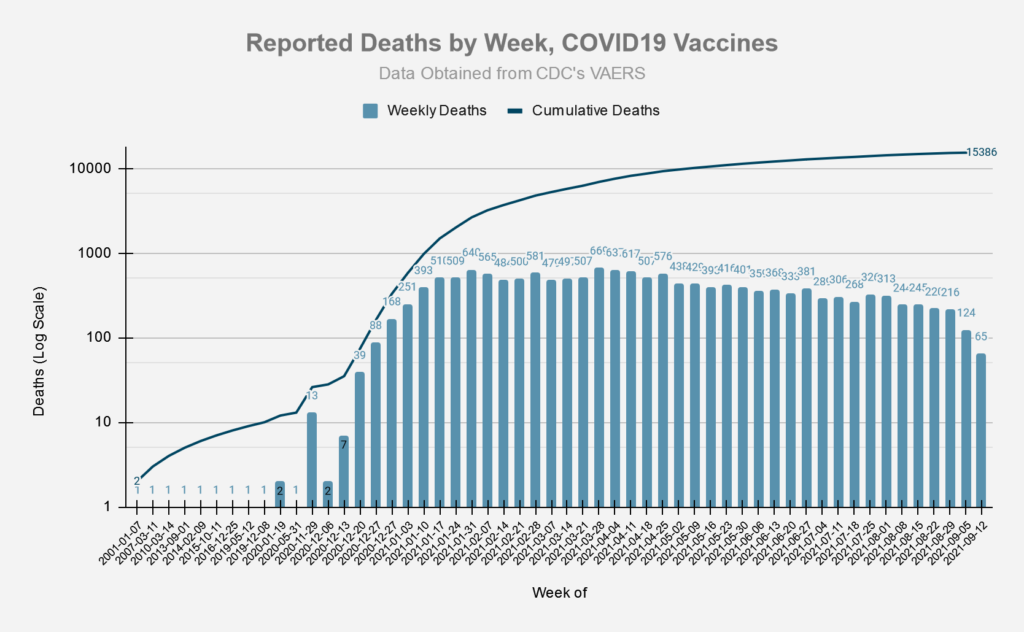
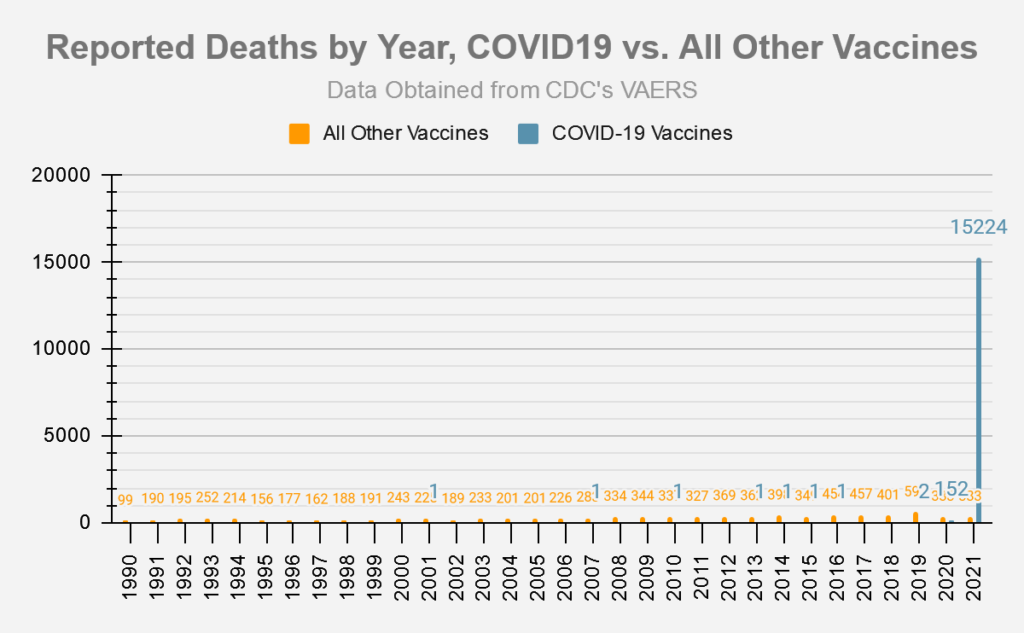
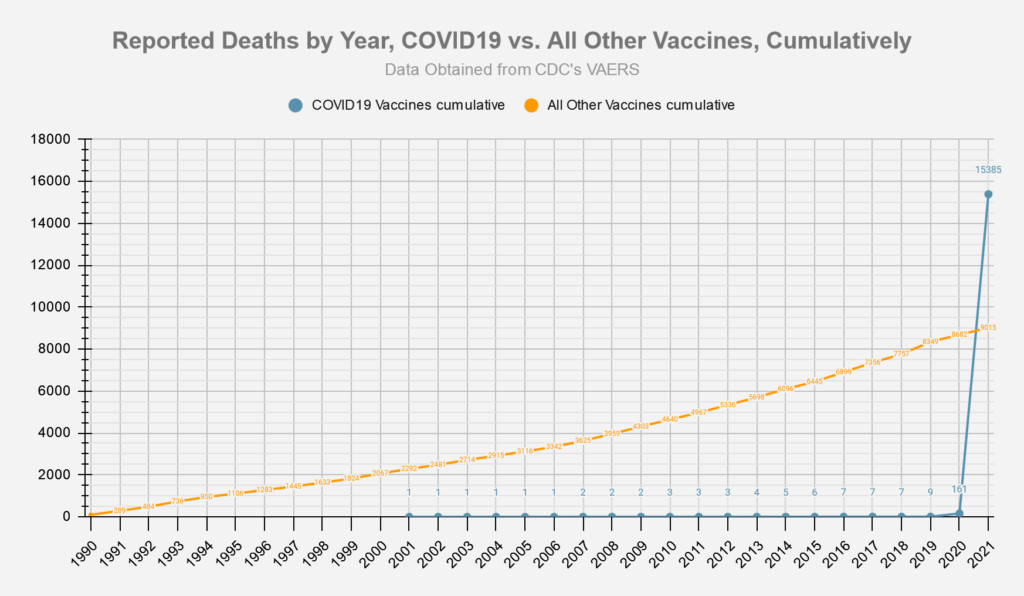
Chart using comparable 9 month periods, since Covid-19 vaccines have only been available for approximately 9 months:
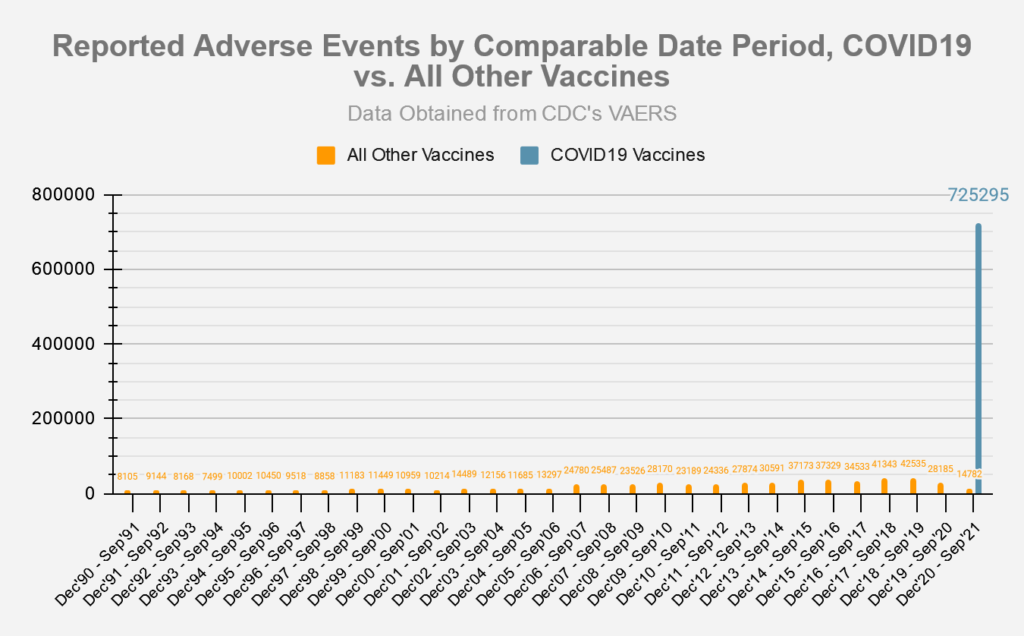
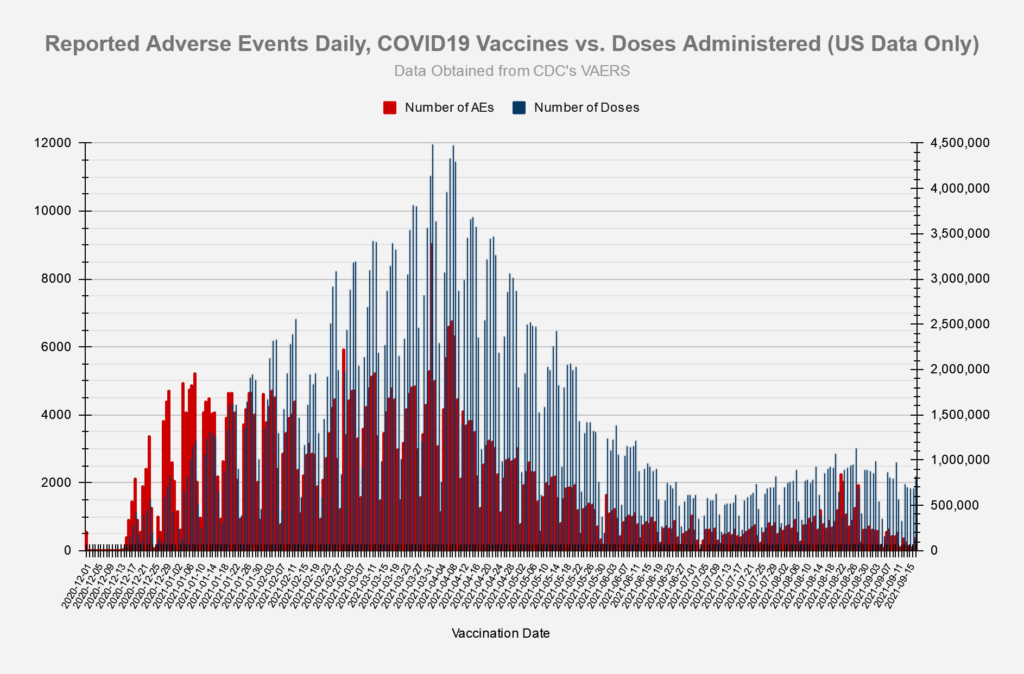
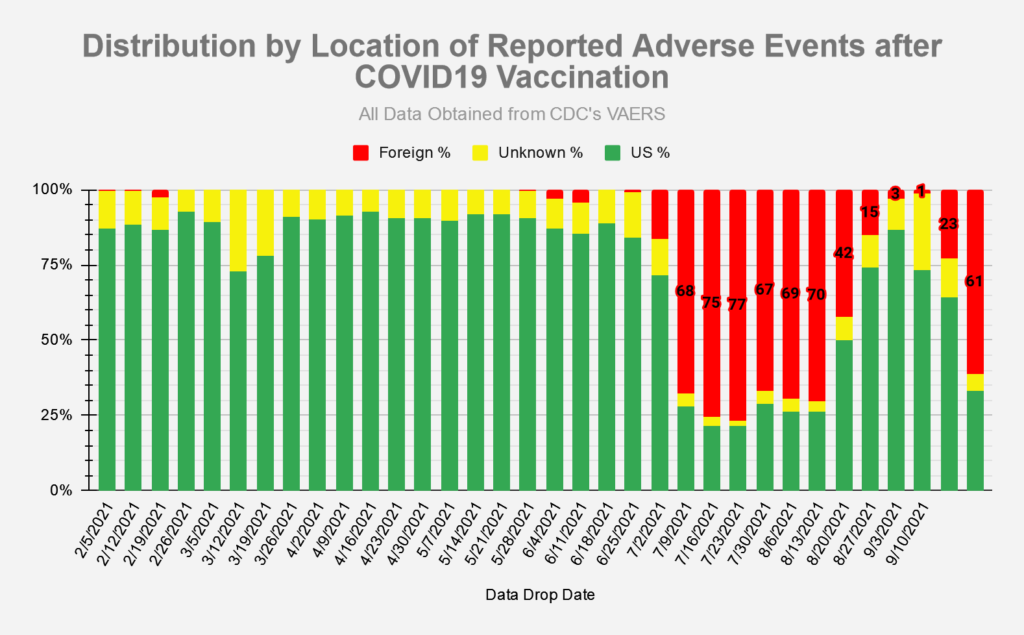
Adverse Events
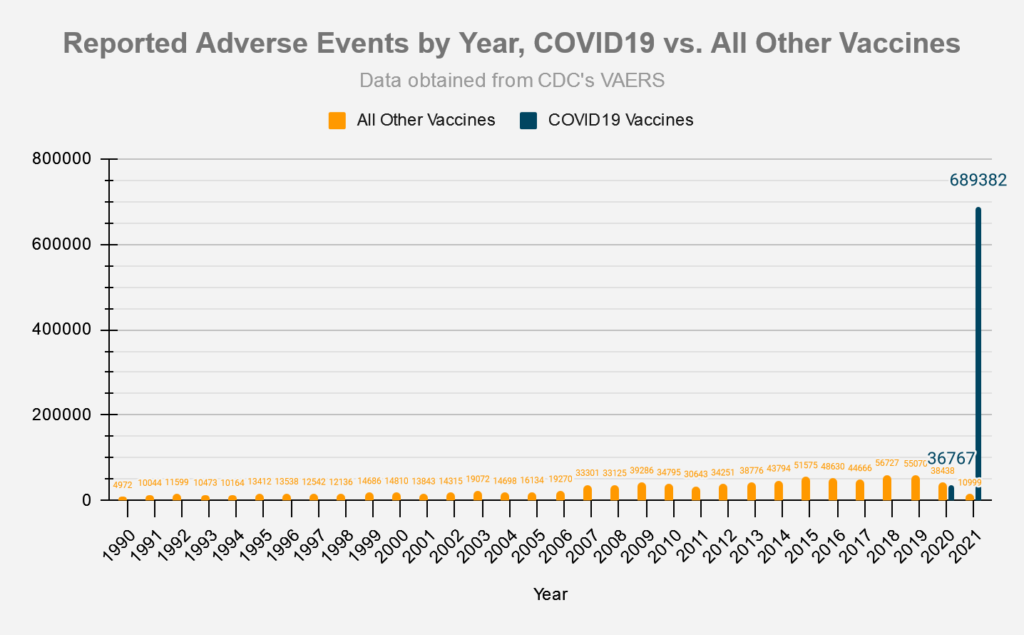
Chart using comparable 9 month periods, since Covid-19 vaccines have only been available for approximately 9 months:
Symptoms
The slide below was taken from an FDA document from October 22, 2020 and provides a list of possible adverse event outcomes related to the Covid-19 vaccines.
- Source: ‘Vaccines and Related Biological Products Advisory Committee October 22,2020 Meeting Presentation”.
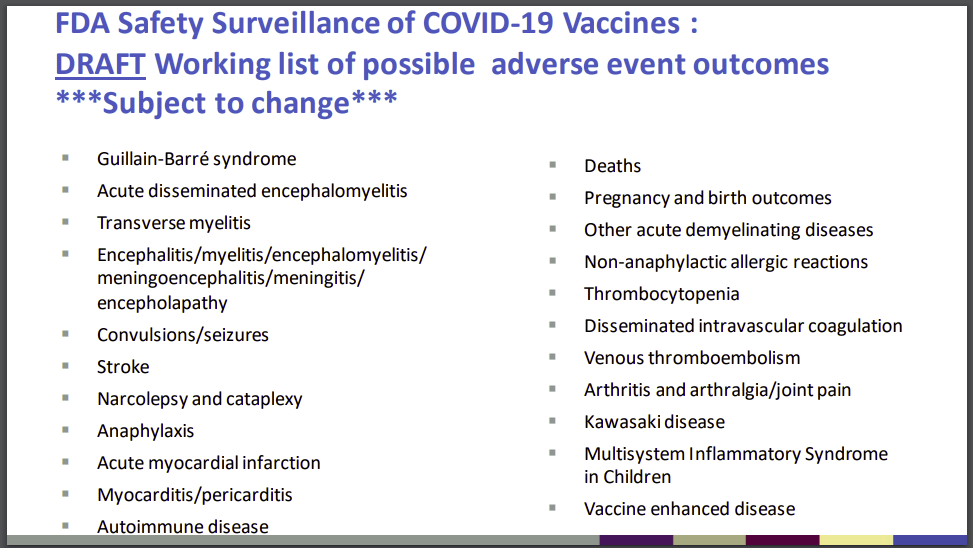
The following table lists the number of adverse events found in the VAERS data which match the outcomes listed above:
| FDA Listed Symptom | Total (Non-Lethal) Adverse Events | Total Deaths |
|---|---|---|
| Guillain-Barre | 1129 | 24 |
| Acute Disseminated Encephalomyelitis | 79 | 3 |
| Transverse Myelitis | 234 | 0 |
| Encephalitis | 944 | 101 |
| Convulsions/Seizures | 8924 | 283 |
| Stroke | 8431 | 825 |
| Narcolepsy, Cataplexy | 169 | 3 |
| Anaphylaxis | 33166 | 135 |
| Acute Myocardial Infarction (Heart Attack) | 2327 | 794 |
| Myocarditis/Pericarditis | 5739 | 91 |
| Autoimmune Disease | 668 | 18 |
| Other Acute Demyelinating Diseases | 155 | 2 |
| Pregnancy and birth outcomes (Miscarriages) | 1959 | 54 |
| Other Allergic Reactions | 1366 | 1 |
| Thrombocytopenia | 2755 | 222 |
| Disseminated Intravascular Coagulation | 123 | 39 |
| Venous Thromboembolism | 12499 | 734 |
| Arthritis and Arthralgia/Joint Pain | 47957 | 138 |
| Kawasaki Disease | 29 | 1 |
| Systemic Inflammatory Response Syndrome | 394 | 25 |
Vaccination Related Risks of COVID19 Vs. Flu
These set of figures compare the COVID19 vaccine to the traditional Flu vaccines. ‘Risk of Death’ percentages depend on the ‘# of Vaccinations’ data, which is only approximate, and was pulled from the CDC’s report on Flu vaccination coverage for the 2019-2020 season, and from Our World in Data for the COVID19 vaccinations.
Covid19 vaccinations through 5/31/2021 vs. Flu vaccinations 7/1/2019 – 5/31/2020 (last complete flu season)
| Vaccine Type | # of Vaccinations[3] | # of Deaths | Risk of Death | Percentage | Deaths/Mill. Vaccinations[3] |
|---|---|---|---|---|---|
| Flu | 167,447,642[1] | 31 | 1 in 5,401,537 | 0.000019% | .19 |
| COVID19 | 167,733,972[2] | 5,382 | 1 in 31,165 | 0.003209% | 32.09 |
| Vaccine Type | # of Vaccinations[3] | # of Adverse Reactions | Risk of Adverse Reaction | Percentage | AEs/Mill. Vaccinations[3] |
|---|---|---|---|---|---|
| Flu | 167,447,642 | 9,672 | 1 in 17,313 | 0.005776% | 57.76 |
| COVID19 | 167,733,972 | 494,583 | 1 in 339 | 0.2949% | 2,949 |
[1] number of flu vaccinations based on estimated flu vaccine coverage data from CDC and estimated population data from US Census. Yearly flu vaccination data covers a period of time from 7/1 to 5/31 of the following year.
[2] number of covid19 vaccinations based on estimates from Our World in Data [2] number of covid19 vaccinations based on estimates from Our World in Data
[3] Persons vaccinated with at least one dose.
Vaccine Data by Manufacturer
| Manufacturer | # of Deaths | % Deaths | Average Deaths/Day | # US Deaths | US Doses Administered | Average US Deaths/Mill. Doses | Days since EUA approval | EUA Approval Date- |
|---|---|---|---|---|---|---|---|---|
| Janssen (JNJ) | 1050 | 6.82% | 5.17 | 713 | 14,876,579 | 47.93 | 203 | 2/26/2021 |
| Moderna | 3794 | 24.64% | 13.9 | 3103 | 150,415,654 | 20.63 | 273 | 12/18/2020 |
| Pfizer/Biontech | 10507 | 68.25% | 37.52 | 3140 | 222,148,207 | 14.13 | 280 | 12/11/2020 |
| Unknown | 44 | 0.29% | 31 | 381,264 |
| Manufacturer | # of AEs | % AEs | Average AEs/Day | # US AEs | US Doses Administered | Average US AEs/Mill. Doses | Days since EUA approval | EUA Approval Date |
|---|---|---|---|---|---|---|---|---|
| Janssen (JNJ) | 56699 | 7.79% | 279.31 | 52063 | 14,876,579 | 3499.66 | 203 | 2/26/2021 |
| Moderna | 292711 | 40.22% | 1072.2 | 274863 | 150,415,654 | 1827.36 | 273 | 12/18/2020 |
| Pfizer/Biontech | 376766 | 51.77% | 1345.59 | 241743 | 222,148,207 | 1088.21 | 280 | 12/11/2020 |
| Unknown | 1528 | 0.21% | 1229 | 381,264 |
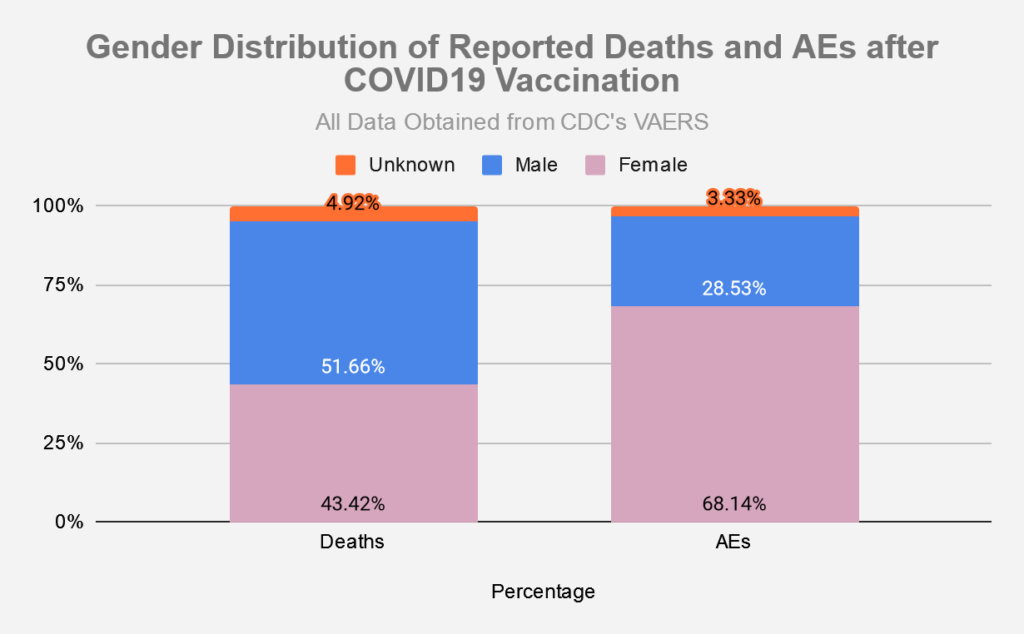
Vaccine Data by Gender
Vaccine Data by Location
Sources
- Vaccine data (Covid-19 and other vaccines) taken from CDC’s VAERS website, located here: https://vaers.hhs.gov/data/datasets.html. VAERS data sets in the form of csv files are pulled down weekly and put into a database for reporting/analysis. Data files are available all the way back to 1990.
- Number of doses distributed for other vaccines found in NVICP Data and Statistics report here: https://www.hrsa.gov/sites/default/files/hrsa/vaccine-compensation/data/data-statistics-report.pdf
- Numbers for Covid-19 vaccines administered by manufacturer found here: https://covid.cdc.gov/covid-data-tracker/#vaccinations_vacc-total-admin-rate-total
- Numbers for total Covid-19 vaccine doses administered found here: https://data.cdc.gov/Vaccinations/COVID-19-Vaccination-Trends-in-the-United-States-N/rh2h-3yt2
- Numbers for Flu vaccine doses administered for 2019-2020 season found here: https://www.cdc.gov/flu/fluvaxview/coverage-1920estimates.htm
Thank you.
[…] website requires one to download files to review the data, but a particularly good non-governmental website graphically and stunningly displays the truth of the skyrocketing instances of adverse reactions to […]
[…] Last, what of the potential side effects from using the “vaccines?” According to the CDC’s vaccine adverse event reporting system (VAERS), there are currently over 16,000 deaths attributed to COVID vaccines in the United States. […]
Wayne,
I’m not sufficiently familiar with the CMS Medicare Tracking System to evaluate the claims of attorney Thomas Renz that it shows many more vaccine adverse events than VAERS.
https://rumble.com/vn12v1-attorney-thomas-renz-we-got-them.-fact-check-this-all-new-whistleblower-inf.html
As he admits, not ALL deaths within 14 days of a shot are necessarily attributable to the vaccine, though many probably are.
But the trove of data he claims access to, via whistleblowers, is undeniably vast.
What do you make of this CMS data? Is it useful for estimating VAERS under-reporting?
Thanks!
Whenever you see death numbers in VAERS or CMS (or any other monitoring system), there are going to be deaths that are not necessarily attributable to the vax. However, we don’t have a great idea what that percentage actually is.
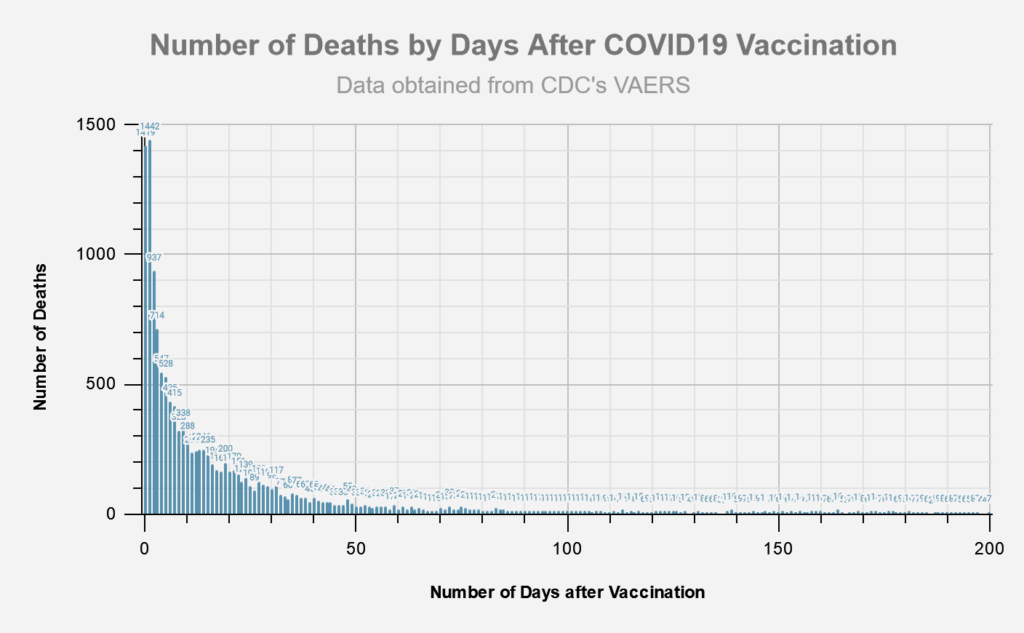
If more autopsies had been done we would have a better idea (of course, autopsies were banned or otherwise prevented in most cases). Though we now have Dr. Schirmacher saying 30-40% of the 40 autopsies he did on the vaxxed deceased were conclusively deaths due to the vax. VAERS underreports by 1-10%, so you could estimate the true number of US covid vax deaths is in the range of 70,215-700,215. If let’s say Dr. Schirmacher is right, and we have to remove some due to not being related to the vax, then the real “true” range, after you take out those who would not be proven linked by autopsy, would be 21,065-210,064 or 28,086-280,860. The CMS data is another data point with real data (that the CDC will no doubt find a way to discount and disparage in some way). It should be better data than VAERS, since it is not “polluted” by lay people submitting “inaccurate” or “false” reports. With Renz’s 48,465 number within 14 days, we have to factor that those numbers are for medicare, which only covers 18.1% of the population, so if you want to project that number onto the entire US population, you would have to multiply by 5.5, which gives you 266,558. If you assume that the shape of the curve on my chart showing Number of Deaths by Days After Vax is going to be the same for Renz’s medicare numbers, then you would know that 60% of the deaths happen in the first 14 days, so the 266,558 number only represents 60%, therefore, the other 40% would be 177,705, for a total of 444,263. Do the autopsy thing again (only 30-40% are actually related) and you get 133,279 or 177,705. Then maybe you can take these numbers and go back to the VAERS ranges above (so stick the 133,279 medicare # into the 21,065-210,064 VAERS range), and you can work backwards to an answer that VAERS reports 6.3% of all adverse reactions. Many assumptions are made here and this is a bit of circuitous logic; rather than proclaiming these as real answers, would prefer that our government health agencies release all their data and let us analyze it and determine how many people are really dead due to these shots…If we lived in a sane world, autopsies would have been required from the get-go, scientists would have discovered alarming rates of deaths due to vax within the first month or less, and this lunatic experiment would have stopped dead in its tracks, saving thousands of lives.
Thanks for your thorough response, Wayne.
An estimated true number of US covid deaths of 70,215-700,215 seems to be about 10 to 100 times the VAERS reported total of around 7,000 … is my understanding correct?
One thing bothers me about Thomas Renz’s Medicare data. In 2007 (latest totals I could find), 1,755,000 Americans in the 65-and-up age cohorts died. Scale that up by 10% to 1,930,000 for 2021, to account for population growth. In a 14-day period, one would expect 1,930,000 x (14/365) = 74,000 baseline deaths. If Renz’s data are for (say) eight months, then 74,000 x (8/12) = 49,300 baseline deaths expected, reasonably matching his total.of 47,465.
But if those baseline deaths would occur anyway, even in a normal pre-pandemic year, then no excess deaths have been demonstrated.
As you point out, though, if deaths during the first 14 days after vaccination represent only 60% of total vaccine deaths, then deaths after 14 days would add another 31,600. That’s close to four times the VAERS death total, even if it proves to be a conservative estimate.
Thomas Renz mentioned statisticians working for him. Hopefully they will anticipate and have well-considered answers to the ‘baseline deaths’ issue which the government’s expert witnesses will surely raise when Medicare death data is introduced at trial.
THANK YOU FOR reporting the truth, although some of these cases may or may not be attributed to the vaccine’s at least people will start to open their eyes to the fact that these vaccine’s are hurting people and the media is silent on all of this. These vaccine’s have divided our countries and our family and friends. People are not doing their research they are just allowing the fear mongering and media/governments to continue to scare them into subjecting to get this toxic crap into their system. God gave you a wonderful immune system, all your immune system to do it’s job. My dad got the Pfizer this year and he was recently diagnosed with bladder cancer. People have to STOP accepting what the media is telling you and do your OWN research. May God keep us all safe. STOP trusting what the media is spoon feeding you and the government, you only have your health at stake here PROTECT IT!
AMEN! Hope your Dad recovers…
[…] Sept. 25). They also question Gov. Scott’s claim about vaccine safety, as [unverified] federal VAERS data show 16,000 deaths and 727,000 adverse health events through September 17, 2021. The vaccine has […]