[Note for this week: Some charts have been “tidied” up. See post here for details.]
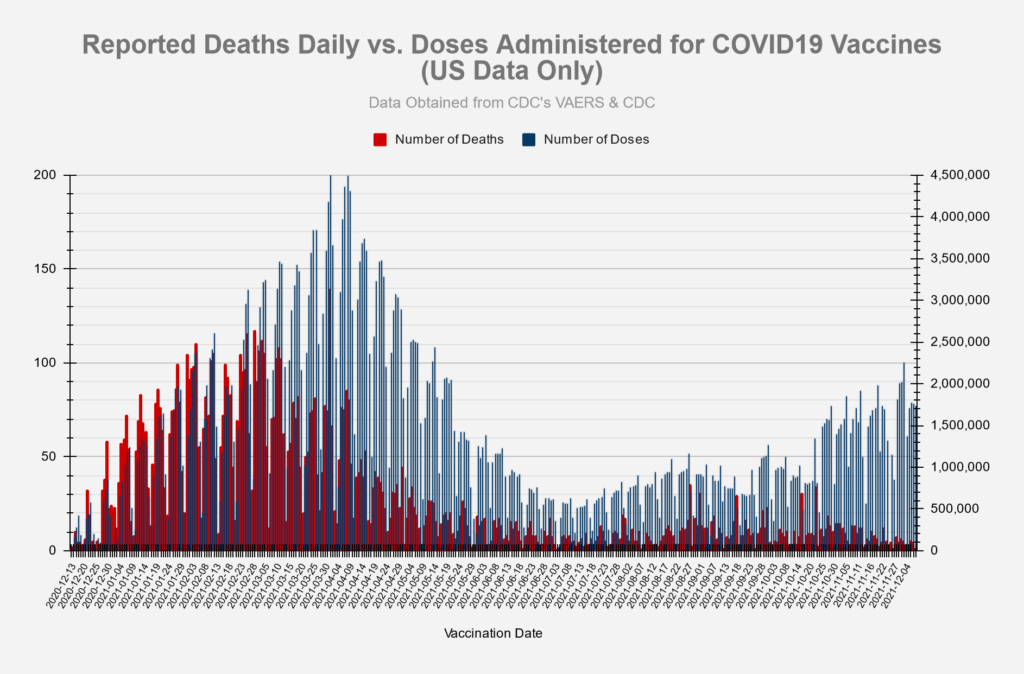
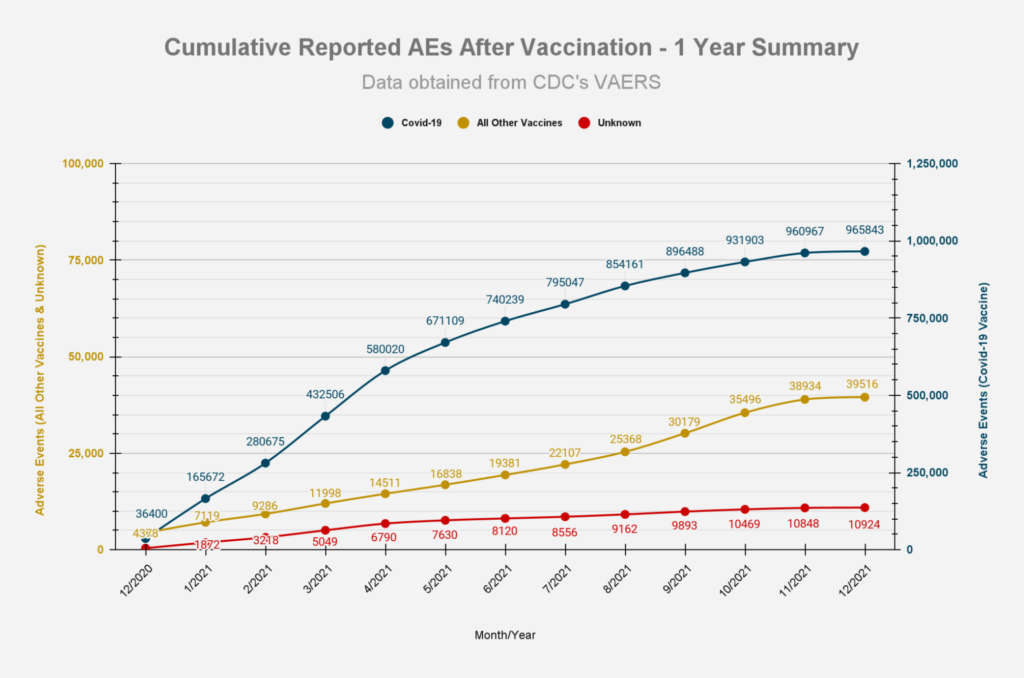
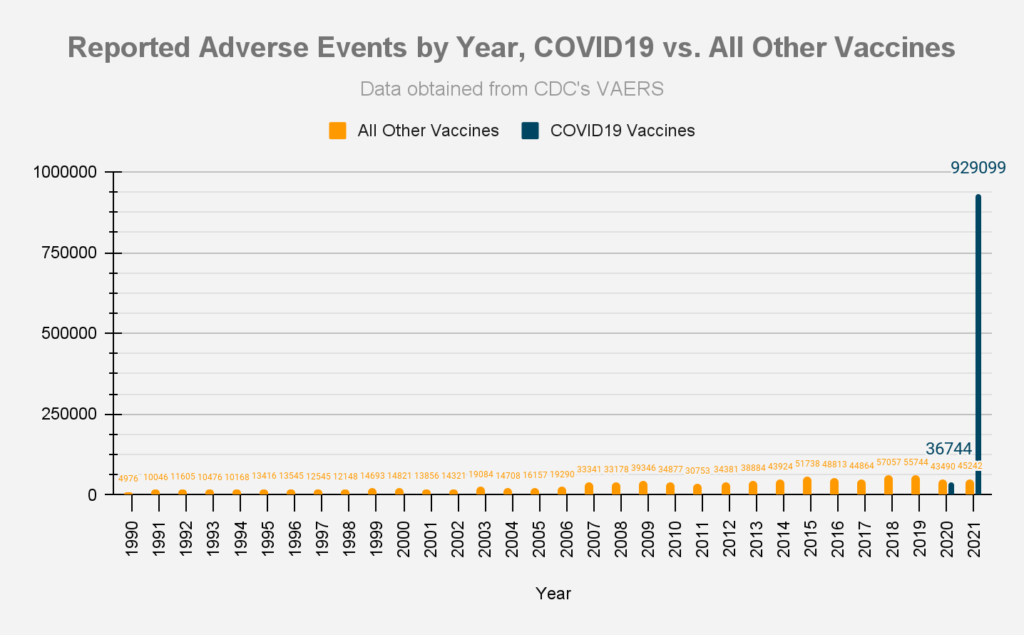
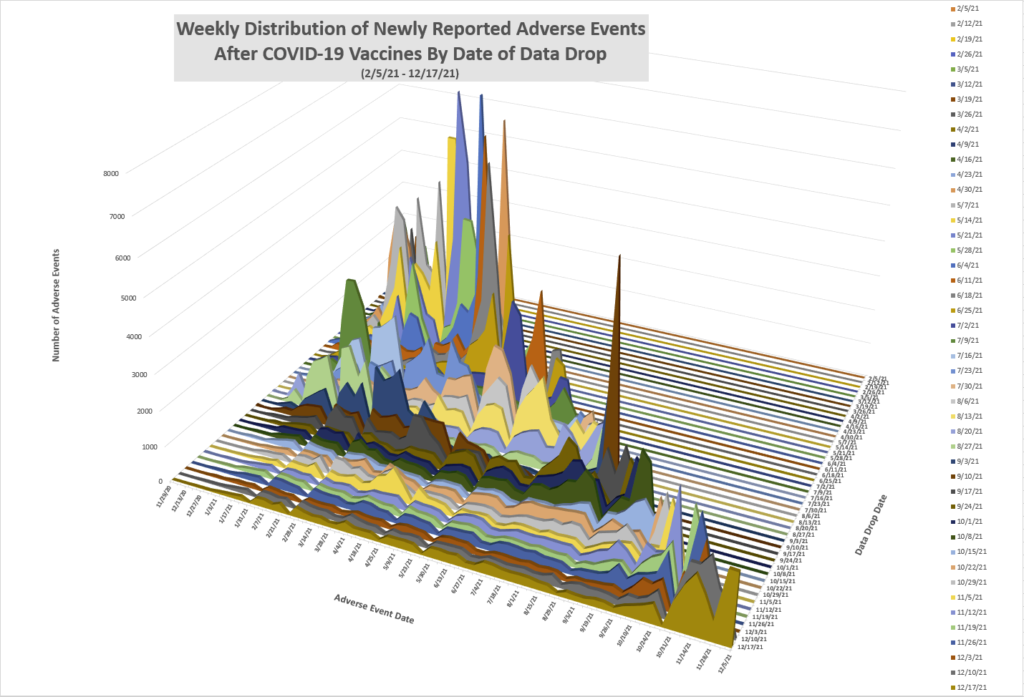
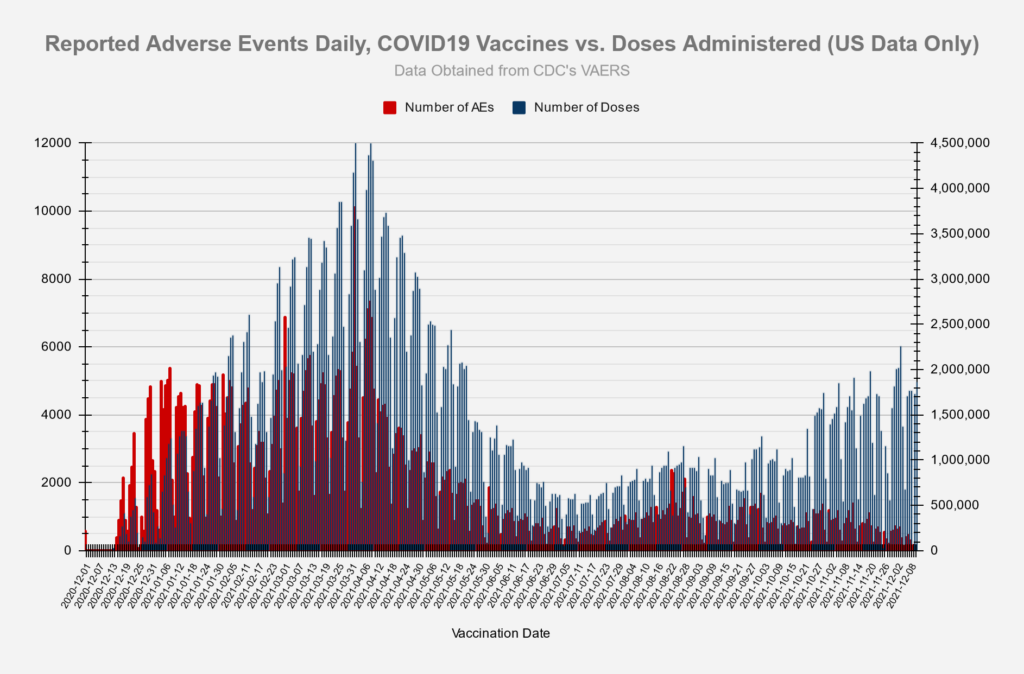
All charts and tables below reflect the data release on 12/17/2021 from the VAERS website, which includes U.S. and foreign data, and is updated through: 12/10/2021
| High-Level Summary | COVID19 vaccines (Dec’2020 – present) | All other vaccines 1990-present | US Data Only COVID19 vaccines (Dec’2020 – present) | US Data Only All other vaccines 1990-present |
|---|---|---|---|---|
| Number of Adverse Reactions | 965,843 | 863,562 | 691,884 | 752,112 |
| Number of Life-Threatening Events | 22,952 | 14,254 | 10,648 | 9,876 |
| Number of Hospitalizations | 106,129 | 82,420 | 44,186 | 38,686 |
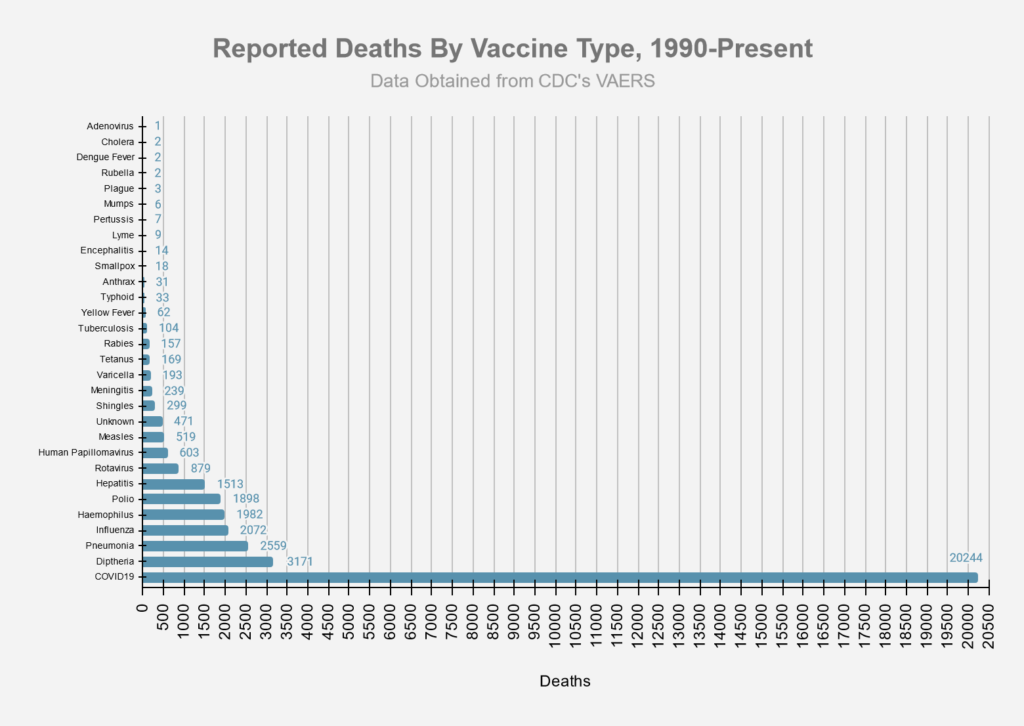
| Number of Deaths | 20,244* | 9,404* | 9,295 | 5,214 |
| # of Permanent Disabilities after vaccination | 33,675 | 20,571 | 10,867 | 12,748 |
| Number of Office Visits | 151,186 | 48,766 | 133,997 | 46,732 |
| # of Emergency Room/Department Visits | 106,239 | 212,126 | 86,161 | 202,689 |
| # of Birth Defects after vaccination | 725 | 185 | 412 | 101 |
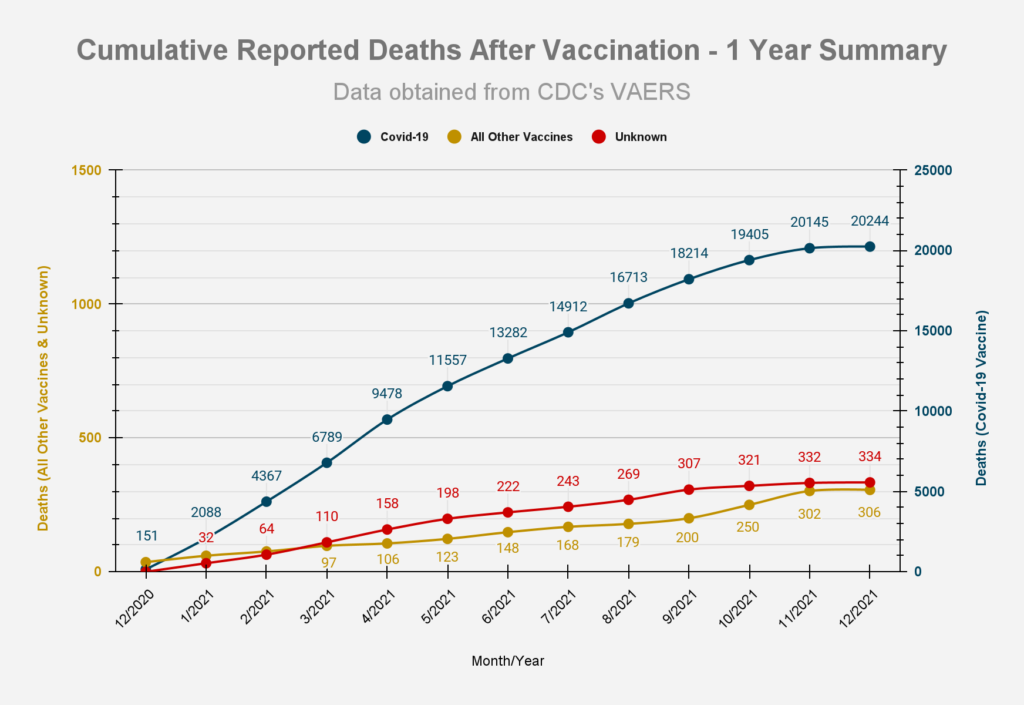
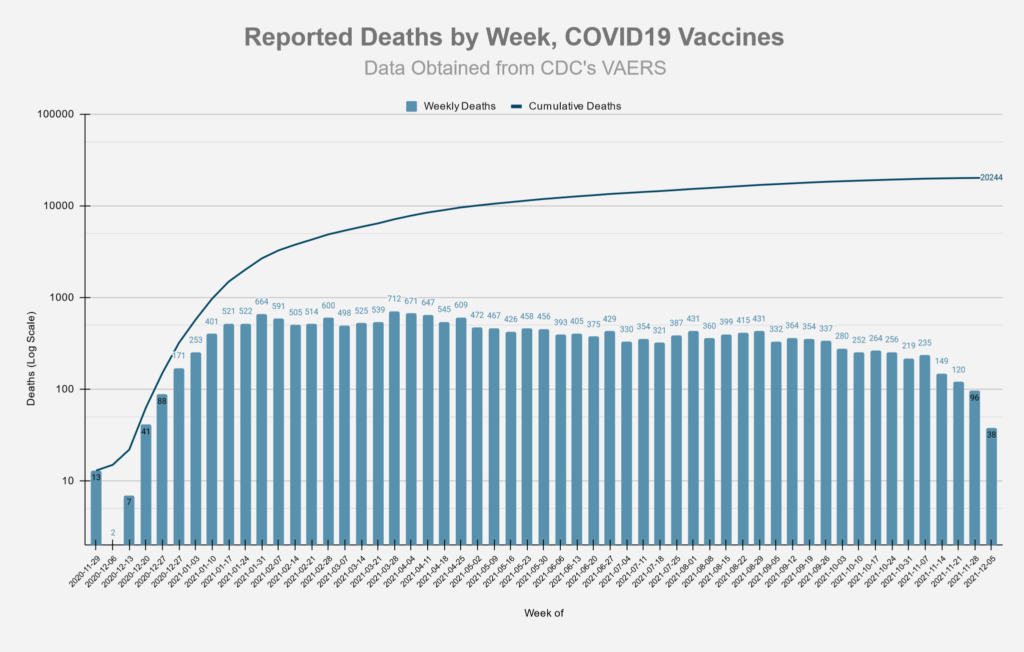
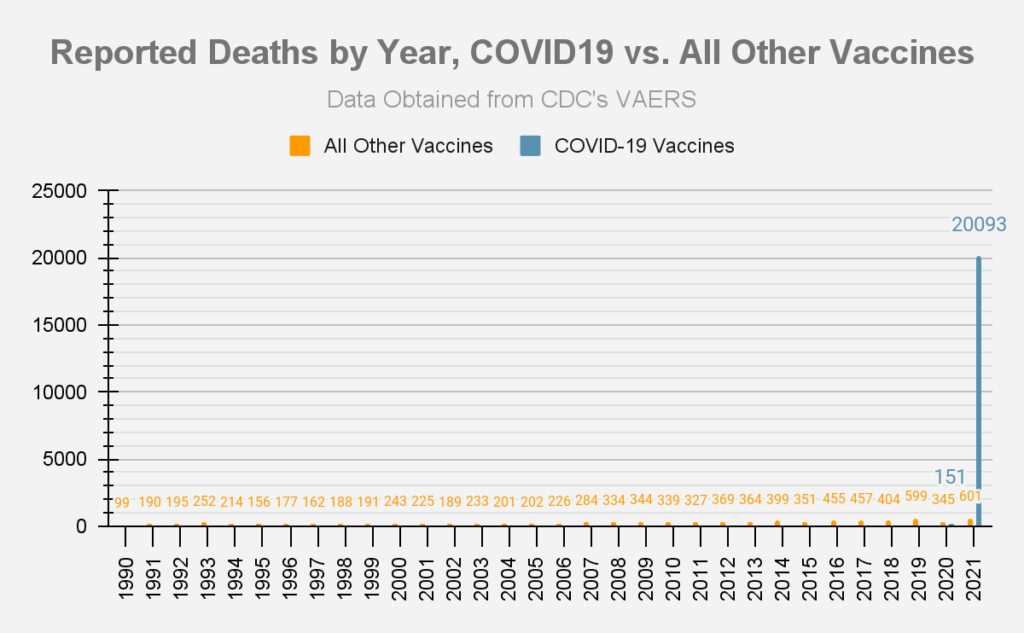
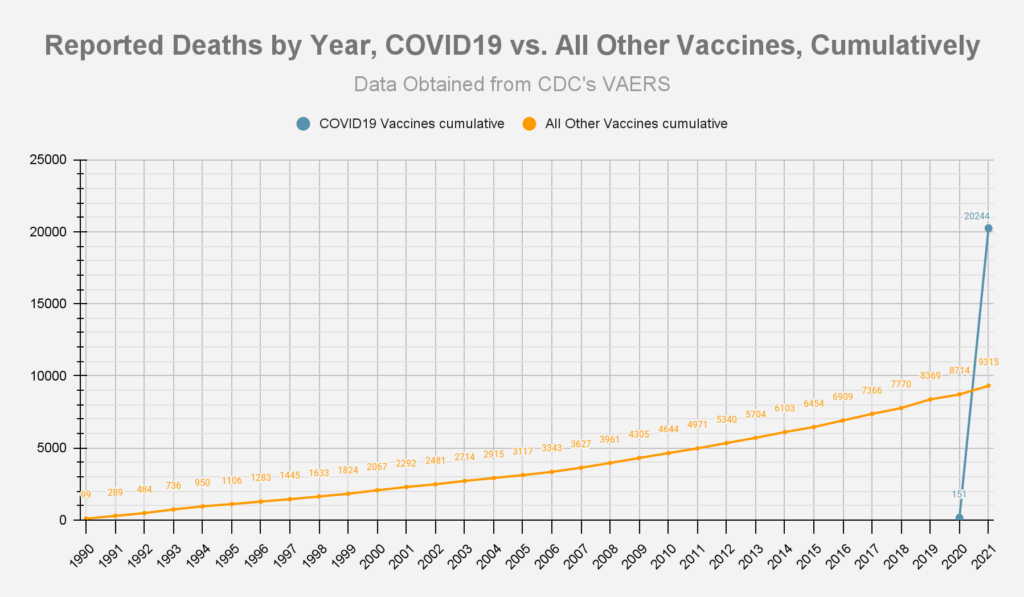
Deaths
Adverse Events
Symptoms
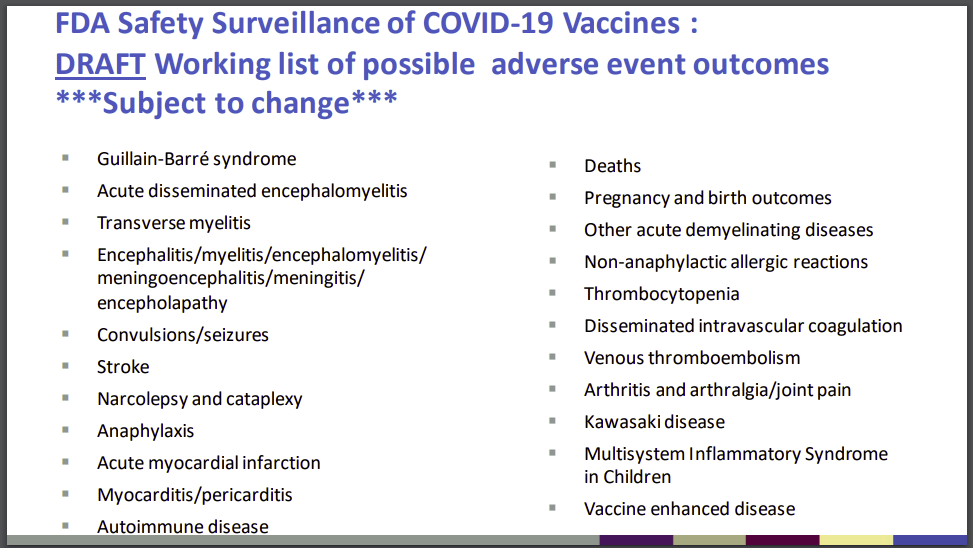
The slide below was taken from an FDA document from October 22, 2020 and provides a list of possible adverse event outcomes related to the Covid-19 vaccines.
- Source: ‘Vaccines and Related Biological Products Advisory Committee October 22,2020 Meeting Presentation”.
The following table lists the number of adverse events found in the VAERS data which match the outcomes listed above:
| FDA Listed Symptom | Total (Non-Lethal) Adverse Events | Total Deaths |
|---|---|---|
| Guillain-Barre | 1902 | 34 |
| Acute Disseminated Encephalomyelitis | 141 | 3 |
| Transverse Myelitis | 338 | 2 |
| Encephalitis | 1567 | 156 |
| Convulsions/Seizures | 12278 | 347 |
| Stroke | 11542 | 1036 |
| Narcolepsy, Cataplexy | 236 | 5 |
| Anaphylaxis | 41222 | 161 |
| Acute Myocardial Infarction (Heart Attack) | 3432 | 1024 |
| Myocarditis/Pericarditis | 13612 | 157 |
| Autoimmune Disease | 1113 | 22 |
| Other Acute Demyelinating Diseases | 255 | 3 |
| Pregnancy and birth outcomes (Miscarriages) | 3112 | 97 |
| Other Allergic Reactions | 1800 | 3 |
| Thrombocytopenia | 4169 | 309 |
| Disseminated Intravascular Coagulation | 180 | 54 |
| Venous Thromboembolism | 17870 | 973 |
| Arthritis and Arthralgia/Joint Pain | 62912 | 187 |
| Kawasaki Disease | 60 | 1 |
| Systemic Inflammatory Response Syndrome | 580 | 44 |
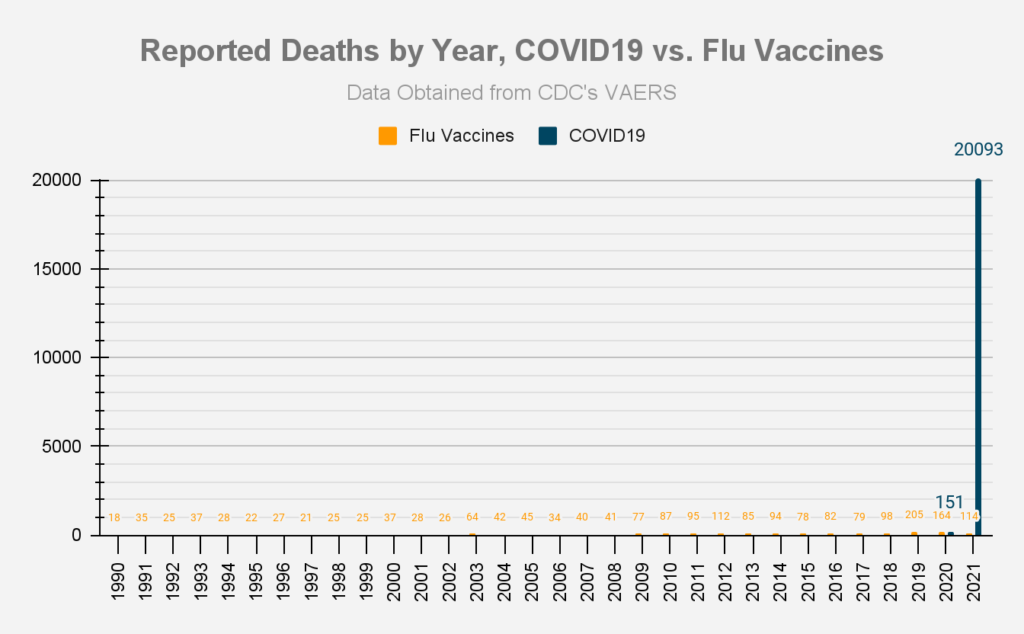
Vaccination Related Risks of COVID19 Vs. Flu
These set of figures compare the COVID19 vaccine to the traditional Flu vaccines. ‘Risk of Death’ percentages depend on the ‘# of Vaccinations’ data, which is only approximate, and was pulled from the CDC’s report on Flu vaccination coverage for the 2019-2020 season, and from Our World in Data for the COVID19 vaccinations.
Covid19 vaccinations through 5/31/2021 vs. Flu vaccinations 7/1/2019 – 5/31/2020 (last complete flu season)
| Vaccine Type | # of Vaccinations[3] | # of Deaths | Risk of Death | Percentage | Deaths/Mill. Vaccinations[3] |
|---|---|---|---|---|---|
| Flu | 167,447,642[1] | 33 | 1 in 5,074,171 | 0.000020% | .20 |
| COVID19 | 167,733,972[2] | 5,595 | 1 in 29,979 | 0.003336% | 33.36 |
| Vaccine Type | # of Vaccinations[3] | # of Adverse Reactions | Risk of Adverse Reaction | Percentage | AEs/Mill. Vaccinations[3] |
|---|---|---|---|---|---|
| Flu | 167,447,642 | 9,710 | 1 in 17,244 | 0.005799% | 57.99 |
| COVID19 | 167,733,972 | 533,980 | 1 in 314 | 0.3183% | 3,183 |
[1] number of flu vaccinations based on estimated flu vaccine coverage data from CDC and estimated population data from US Census. Yearly flu vaccination data covers a period of time from 7/1 to 5/31 of the following year.
[2] number of covid19 vaccinations based on estimates from Our World in Data [2] number of covid19 vaccinations based on estimates from Our World in Data
[3] Persons vaccinated with at least one dose.
Vaccine Data by Manufacturer
| Manufacturer | # of Deaths | % Deaths | Average Deaths/Day | # US Deaths | US Doses Administered | Average US Deaths/Mill. Doses | Days since EUA approval | EUA Approval Date- |
|---|---|---|---|---|---|---|---|---|
| Janssen (JNJ) | 1687 | 8.33% | 5.88 | 1071 | 17,311,789 | 61.87 | 287 | 2/26/2021 |
| Moderna | 4996 | 24.66% | 13.99 | 3914 | 187,111,796 | 20.92 | 357 | 12/18/2020 |
| Pfizer/Biontech | 13493 | 66.61% | 37.07 | 4278 | 285,106,254 | 15 | 364 | 12/11/2020 |
| Unknown | 81 | 0.4% | 40 | 501,010 |
| Manufacturer | # of AEs | % AEs | Average AEs/Day | # US AEs | US Doses Administered | Average US AEs/Mill. Doses | Days since EUA approval | EUA Approval Date |
|---|---|---|---|---|---|---|---|---|
| Janssen (JNJ) | 71819 | 7.42% | 250.24 | 61824 | 17,311,789 | 3571.21 | 287 | 2/26/2021 |
| Moderna | 356094 | 36.81% | 997.46 | 319439 | 187,111,796 | 1707.21 | 357 | 12/18/2020 |
| Pfizer/Biontech | 537231 | 55.54% | 1475.91 | 310254 | 285,106,254 | 1088.2 | 364 | 12/11/2020 |
| Unknown | 2191 | 0.23% | 1555 | 501,010 |
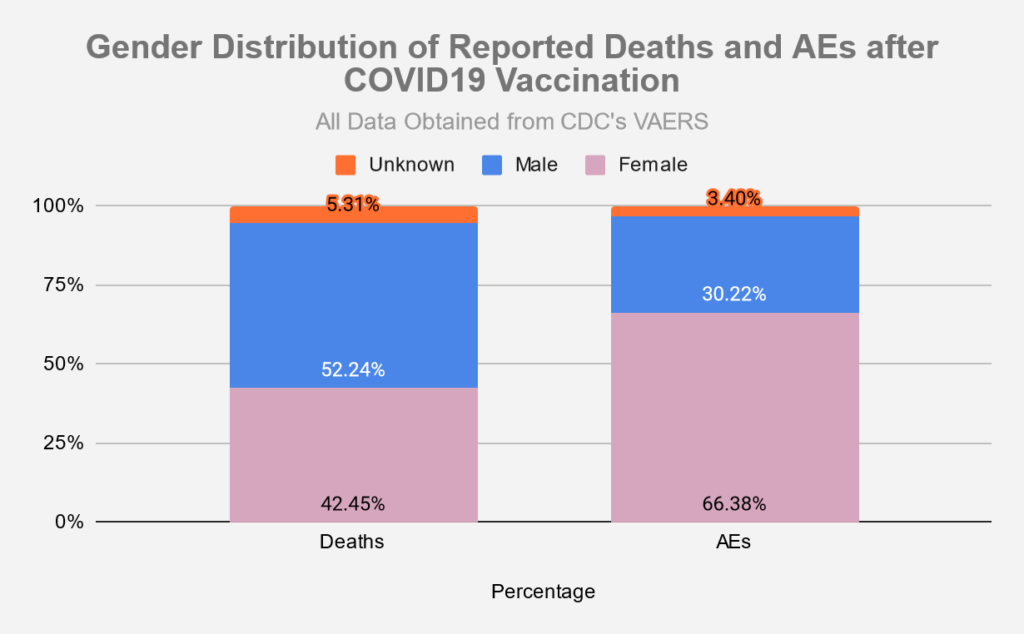
Vaccine Data by Gender
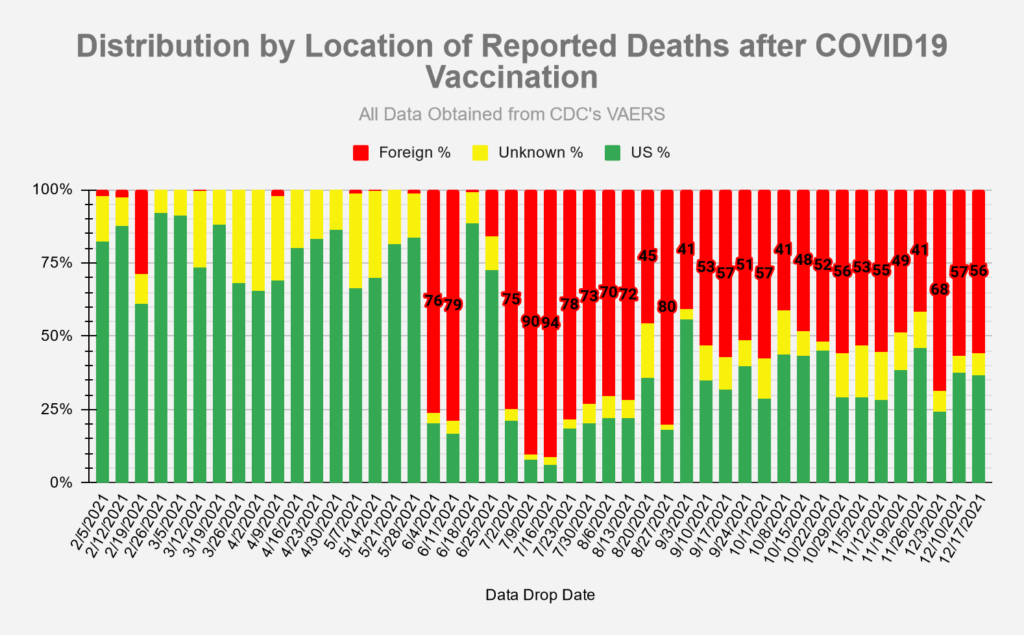
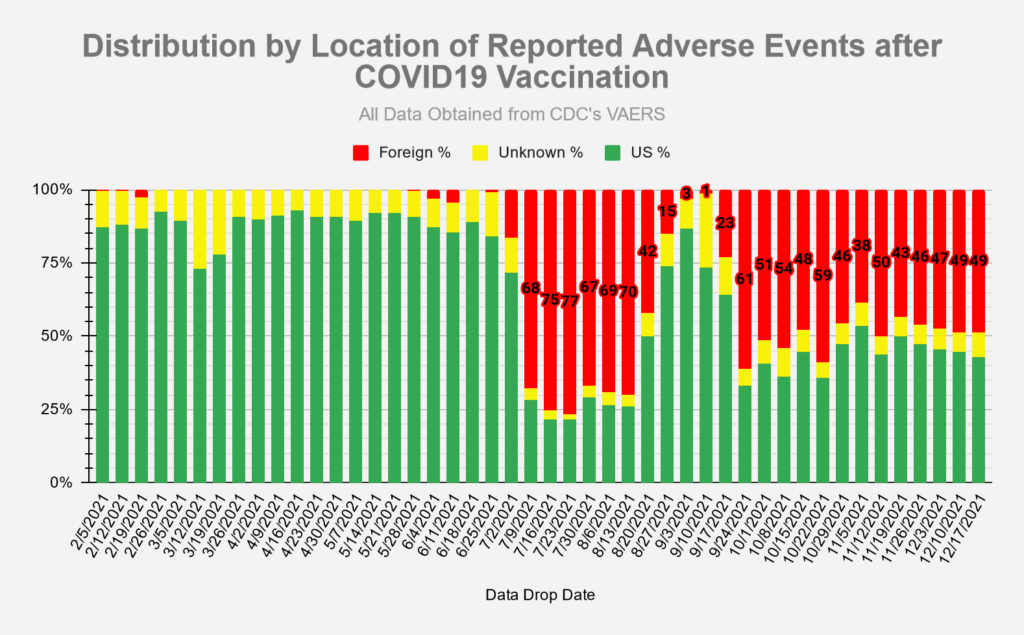
Vaccine Data by Location
Recall History
Sources
- Vaccine data (Covid-19 and other vaccines) taken from CDC’s VAERS website, located here: https://vaers.hhs.gov/data/datasets.html. VAERS data sets in the form of csv files are pulled down weekly and put into a database for reporting/analysis. Data files are available all the way back to 1990.
- Number of doses distributed for other vaccines found in NVICP Data and Statistics report here: https://www.hrsa.gov/sites/default/files/hrsa/vaccine-compensation/data/data-statistics-report.pdf
- Numbers for Covid-19 vaccines administered by manufacturer found here: https://covid.cdc.gov/covid-data-tracker/#vaccinations_vacc-total-admin-rate-total
- Numbers for total Covid-19 vaccine doses administered found here: https://data.cdc.gov/Vaccinations/COVID-19-Vaccination-Trends-in-the-United-States-N/rh2h-3yt2
- Numbers for Flu vaccine doses administered for 2019-2020 season found here: https://www.cdc.gov/flu/fluvaxview/coverage-1920estimates.htm
- Numbers for FDA regulated drugs taken from FDA’s FAERS website, located here: https://www.fda.gov/drugs/questions-and-answers-fdas-adverse-event-reporting-system-faers/fda-adverse-event-reporting-system-faers-public-dashboard
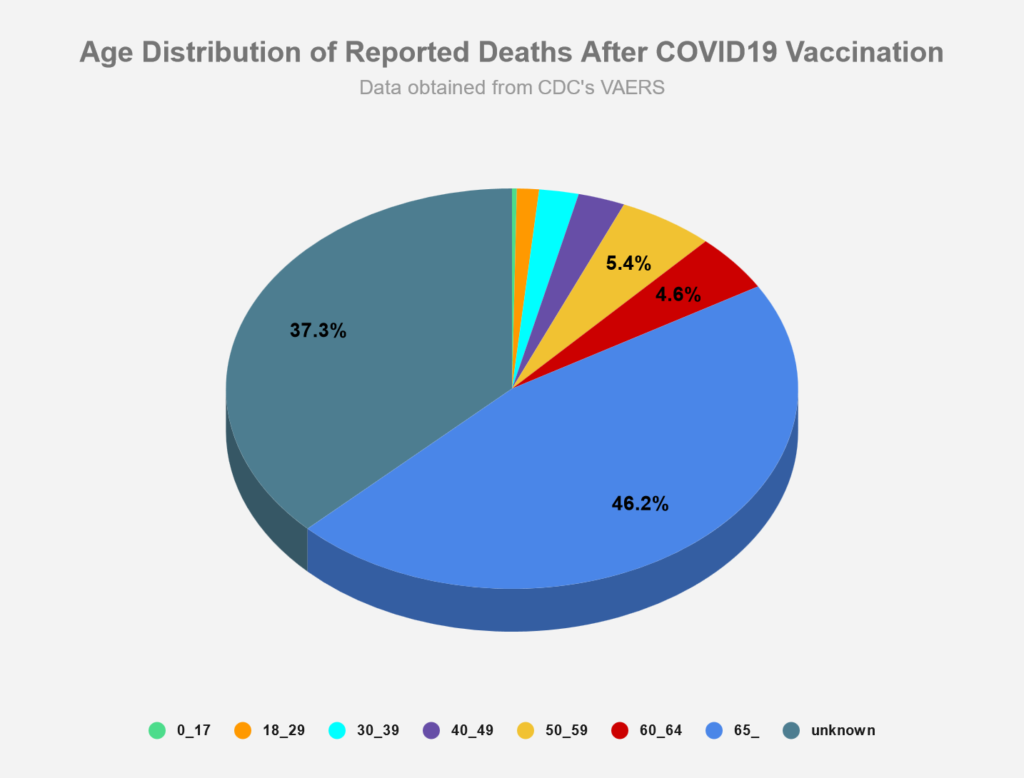
Age distribution of reported deaths should be a histogram with unequal bin widths, not a pie chart. Ugh that chart is useless.
[…] VAERS Summary for COVID-19 Vaccines through 12/10/2021 […]
Can you please somehow include the search criteria you used in the CDC database? I want to share this page around, but I want to verify it against the dataset first.
Thank you
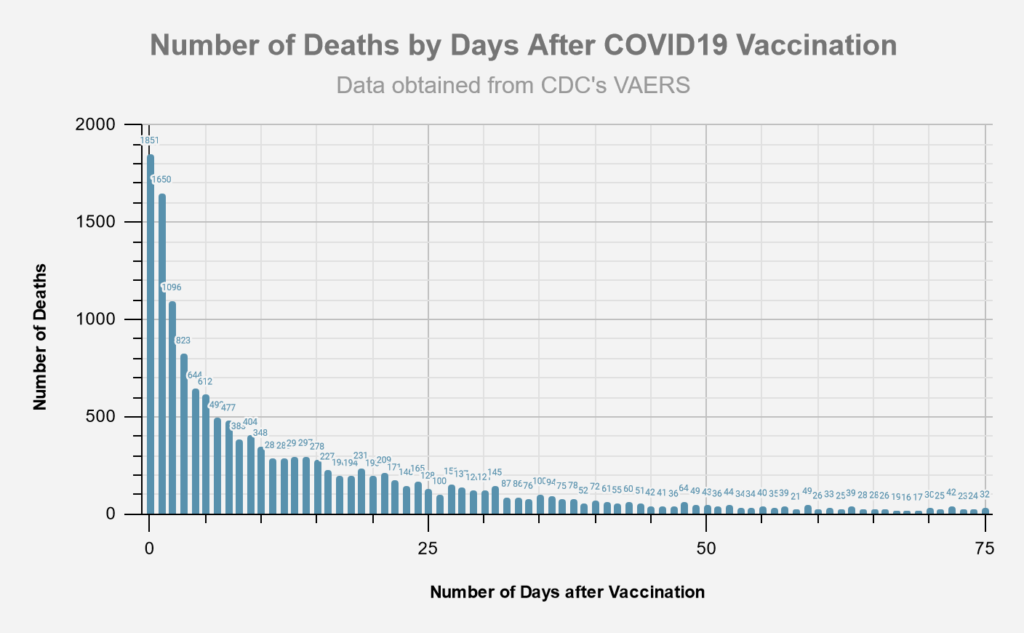
Safe? Not so much. Effective? At killing and injuring people, very effective. The long slow kill of people as they are weakened for other diseases to take them out makes it also a stealthy kill. To get the whole picture, focus on all-cause mortality jabbed vs unjabbed. And make sure the jabbed numbers are anyone who got 1 jab from day one, not cooking the numbers by only counting people as jabbed months after the first one. Tens of thousands died within days of being jabbed, and are being counted as unjabbed until 2 weeks after 2nd lethal injection.
[…] of Vaccine-Induced Immune Thrombocytopenia and Thrombosis.” N Engl J Med 2021; 385:1680-1689 [3] https://vaersanalysis.info/2021/12/18/vaers-summary-for-covid-19-vaccines-through-12-10-2021/ [4] […]
Awesome page!
Is it possible to track AEs and Deaths by location within the US?
Thanks
Remember that reportage to VAERS of side effects is only thought to be 10-20% of actual side effects. Even if it is 50%, these numbers are grossly underestimated.
When I had side effects from the Moderna vaccine, I reported them to the VAERS database. Since the report, I’ve had other unusual side effects and turns out I was one of the unlucky people to get a bad batch. How can I look up to see what kinds of disabilities or life threatening illness may occur in the near future? I tried the VAERS data base with my batch number and VAERS E-report number.
Chris,
post your batch number and I’ll look it up.
[…] SOURCE – […]