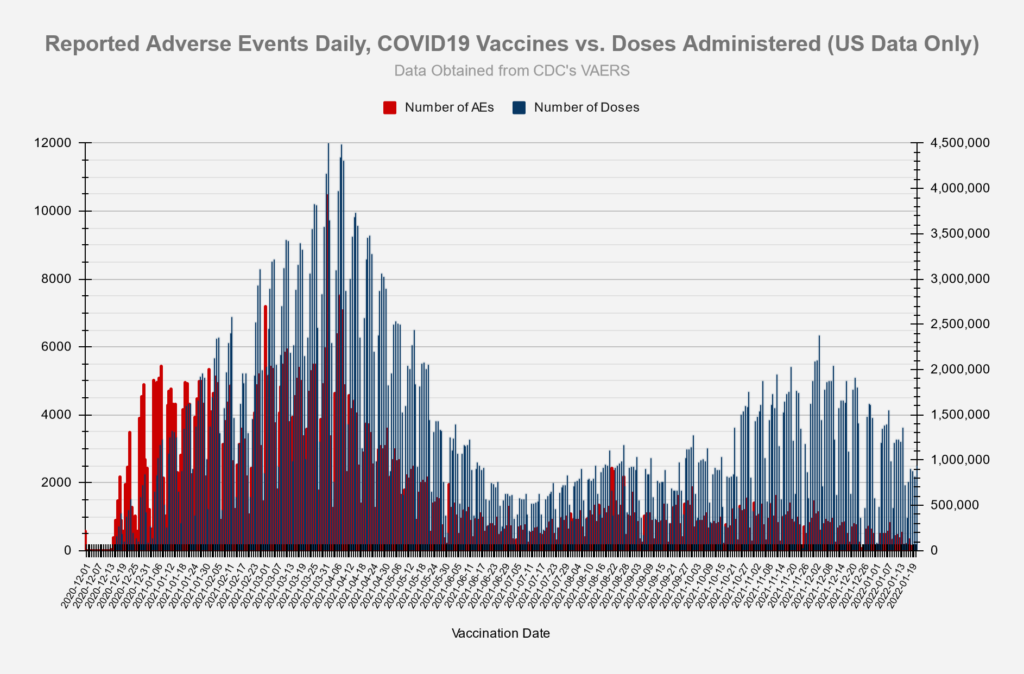
All charts and tables below reflect the data release on 01/28/2022 from the VAERS website, which includes U.S. and foreign data, and is updated through: 1/21/2022
| High-Level Summary | COVID19 vaccines (Dec’2020 – present) | All other vaccines 1990-present | US Data Only COVID19 vaccines (Dec’2020 – present) | US Data Only All other vaccines 1990-present |
|---|---|---|---|---|
| Number of Adverse Reactions | 1,071,856 | 869,396 | 740,000 | 756,744 |
| Number of Life-Threatening Events | 25,776 | 14,345 | 11,529 | 9,916 |
| Number of Hospitalizations | 121,597 | 82,987 | 50,387 | 38,857 |
| Number of Deaths | 22,607* | 9,491* | 10,316 | 5,260 |
| # of Permanent Disabilities after vaccination | 40,069 | 20,764 | 12,033 | 12,839 |
| Number of Office Visits | 166,737 | 49,570 | 145,347 | 47,432 |
| # of Emergency Room/Department Visits | 115,237 | 212,528 | 91,991 | 203,019 |
| # of Birth Defects after vaccination | 870 | 191 | 458 | 104 |
Deaths


Adverse Events


Symptoms
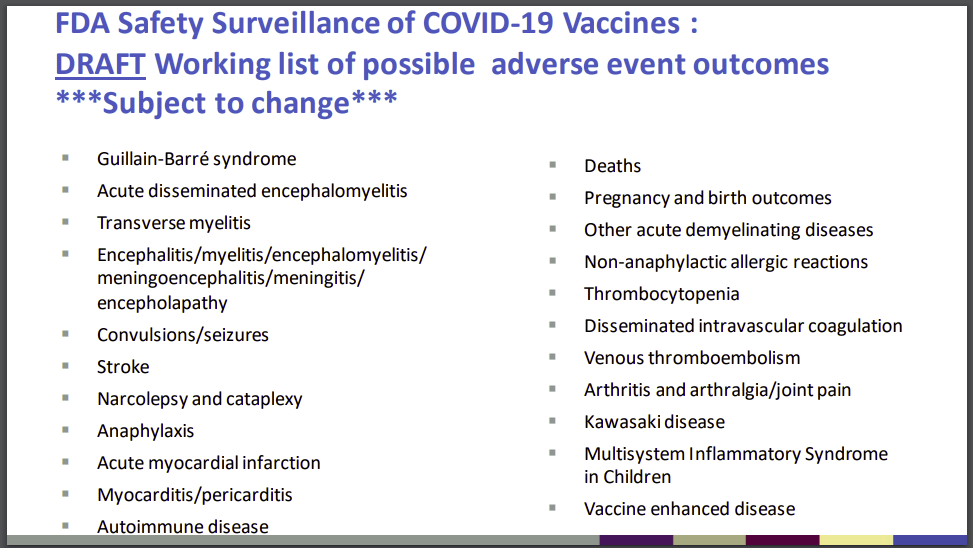
The slide below was taken from an FDA document from October 22, 2020 and provides a list of possible adverse event outcomes related to the Covid-19 vaccines.
- Source: ‘Vaccines and Related Biological Products Advisory Committee October 22,2020 Meeting Presentation”.
The following table lists the number of adverse events found in the VAERS data which match the outcomes listed above:
| FDA Listed Symptom | Total (Non-Lethal) Adverse Events | Total Deaths |
|---|---|---|
| Guillain-Barre | 2155 | 37 |
| Acute Disseminated Encephalomyelitis | 156 | 6 |
| Transverse Myelitis | 390 | 3 |
| Encephalitis | 1828 | 191 |
| Convulsions/Seizures | 13490 | 401 |
| Stroke | 12878 | 1180 |
| Narcolepsy, Cataplexy | 256 | 5 |
| Anaphylaxis | 44937 | 165 |
| Acute Myocardial Infarction (Heart Attack) | 3900 | 1161 |
| Myocarditis/Pericarditis | 16847 | 193 |
| Autoimmune Disease | 1286 | 24 |
| Other Acute Demyelinating Diseases | 293 | 5 |
| Pregnancy and birth outcomes (Miscarriages) | 3565 | 113 |
| Other Allergic Reactions | 2010 | 3 |
| Thrombocytopenia | 4661 | 345 |
| Disseminated Intravascular Coagulation | 199 | 62 |
| Venous Thromboembolism | 20050 | 1141 |
| Arthritis and Arthralgia/Joint Pain | 69385 | 202 |
| Kawasaki Disease | 70 | 1 |
| Systemic Inflammatory Response Syndrome | 653 | 48 |
Vaccination Related Risks of COVID19 Vs. Flu
These set of figures compare the COVID19 vaccine to the traditional Flu vaccines. ‘Risk of Death’ percentages depend on the ‘# of Vaccinations’ data, which is only approximate, and was pulled from the CDC’s report on Flu vaccination coverage for the 2019-2020 season, and from Our World in Data for the COVID19 vaccinations.
Covid19 vaccinations through 5/31/2021 vs. Flu vaccinations 7/1/2019 – 5/31/2020 (last complete flu season)
| Vaccine Type | # of Vaccinations[3] | # of Deaths | Risk of Death | Percentage | Deaths/Mill. Vaccinations[3] |
|---|---|---|---|---|---|
| Flu | 167,447,642[1] | 33 | 1 in 5,074,171 | 0.000020% | .20 |
| COVID19 | 167,733,972[2] | 5,654 | 1 in 29,666 | 0.003371% | 33.71 |
| Vaccine Type | # of Vaccinations[3] | # of Adverse Reactions | Risk of Adverse Reaction | Percentage | AEs/Mill. Vaccinations[3] |
|---|---|---|---|---|---|
| Flu | 167,447,642 | 9,717 | 1 in 17,232 | 0.005803% | 58.03 |
| COVID19 | 167,733,972 | 545,963 | 1 in 307 | 0.3255% | 3,255 |
[1] number of flu vaccinations based on estimated flu vaccine coverage data from CDC and estimated population data from US Census. Yearly flu vaccination data covers a period of time from 7/1 to 5/31 of the following year.
[2] number of covid19 vaccinations based on estimates from Our World in Data [2] number of covid19 vaccinations based on estimates from Our World in Data
[3] Persons vaccinated with at least one dose.

Vaccine Data by Manufacturer
| Manufacturer | # of Deaths | % Deaths | Average Deaths/Day | # US Deaths | US Doses Administered | Average US Deaths/Mill. Doses | Days since EUA approval | EUA Approval Date- |
|---|---|---|---|---|---|---|---|---|
| Janssen (JNJ) | 2014 | 8.9% | 6.12 | 1314 | 18,128,738 | 72.48 | 329 | 2/26/2021 |
| Moderna | 5582 | 24.67% | 13.99 | 4270 | 203,409,636 | 20.99 | 399 | 12/18/2020 |
| Pfizer/Biontech | 14941 | 66.02% | 36.8 | 4703 | 314,361,546 | 14.96 | 406 | 12/11/2020 |
| Unknown | 94 | 0.42% | 42 | 471,027 |
| Manufacturer | # of AEs | % AEs | Average AEs/Day | # US AEs | US Doses Administered | Average US AEs/Mill. Doses | Days since EUA approval | EUA Approval Date |
|---|---|---|---|---|---|---|---|---|
| Janssen (JNJ) | 78473 | 7.31% | 238.52 | 65625 | 18,128,738 | 3619.94 | 329 | 2/26/2021 |
| Moderna | 389189 | 36.24% | 975.41 | 339164 | 203,409,636 | 1667.39 | 399 | 12/18/2020 |
| Pfizer/Biontech | 603623 | 56.2% | 1486.76 | 334924 | 314,361,546 | 1065.41 | 406 | 12/11/2020 |
| Unknown | 2781 | 0.26% | 1684 | 471,027 |
Vaccine Data by Gender

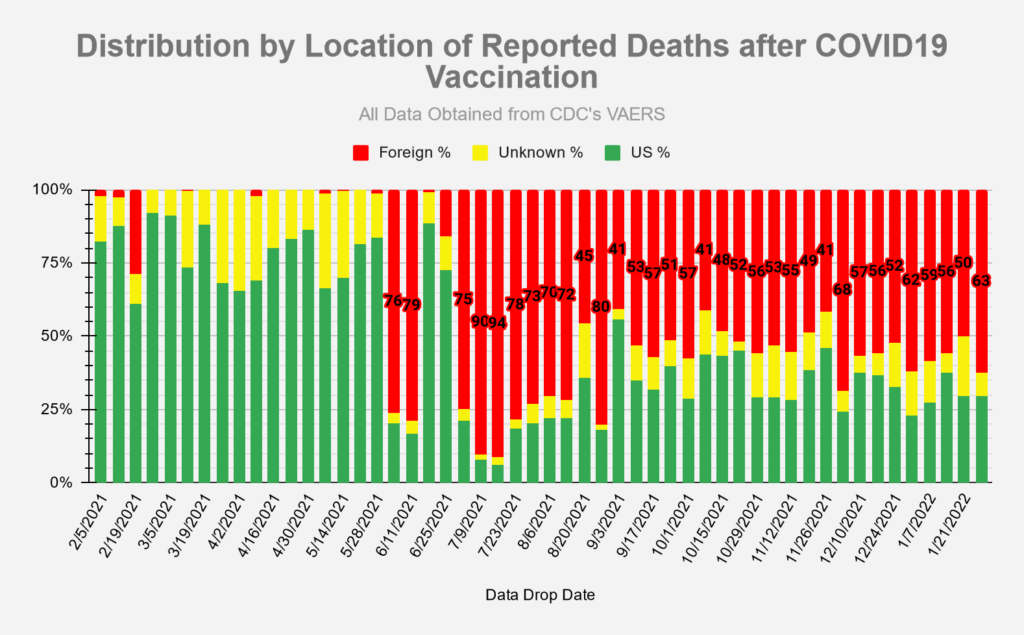
Vaccine Data by Location

Recall History
*Projected
Sources
- Vaccine data (Covid-19 and other vaccines) taken from CDC’s VAERS website, located here: https://vaers.hhs.gov/data/datasets.html. VAERS data sets in the form of csv files are pulled down weekly and put into a database for reporting/analysis. Data files are available all the way back to 1990.
- Number of doses distributed for other vaccines found in NVICP Data and Statistics report here: https://www.hrsa.gov/sites/default/files/hrsa/vaccine-compensation/data/data-statistics-report.pdf
- Numbers for Covid-19 vaccines administered by manufacturer found here: https://covid.cdc.gov/covid-data-tracker/#vaccinations_vacc-total-admin-rate-total
- Numbers for total Covid-19 vaccine doses administered found here: https://data.cdc.gov/Vaccinations/COVID-19-Vaccination-Trends-in-the-United-States-N/rh2h-3yt2
- Numbers for Flu vaccine doses administered for 2019-2020 season found here: https://www.cdc.gov/flu/fluvaxview/coverage-1920estimates.htm
- Numbers for FDA regulated drugs taken from FDA’s FAERS website, located here: https://www.fda.gov/drugs/questions-and-answers-fdas-adverse-event-reporting-system-faers/fda-adverse-event-reporting-system-faers-public-dashboard
[…] Click this link for the original source of this article. Author: WayneTheDBA […]
would be great to see a breakdown of adverse events/deaths per dose by age group considering the FDA is about to approve the vaccines for 6month olds+.
Excellent information!
[…] VAERS Summary for COVID-19 Vaccines through 01/21/2022 Posted in Uncategorized […]
[…] VAERS Summary for COVID-19 Vaccines through 01/21/2022 Posted in Adverse Event Reporting, Safety Studies, Vaccine News, VARES […]
[…] SOURCE – […]
[…] Original Link Here […]
[…] VAERS Analysis 28 January 2022 […]
Check deaths and adverse events correlation to zip codes to see if poverty or specific areas have been targeted……..
[…] was initially comfortable with the COVID-19 vaccines until he saw the VAERS reports. He also noted a shift in the way past treatments and vaccines had been responsibly […]
[…] was initially comfortable with the COVID-19 vaccines until he saw the VAERS reports. He also noted a shift in the way past treatments and vaccines had been responsibly […]
[…] The AMA’s brief failed to mention the injuries reported to the government-run Vaccine Adverse Effects Reporting System (“VAERS”). AAPS responded by informing the court that “the total number of deaths associated with the COVID-19 vaccines is more than double the number of deaths associated with all other vaccines combined since the year ….” […]
[…] The AMA’s brief failed to mention the injuries reported to the government-run Vaccine Adverse Effects Reporting System (“VAERS”). AAPS responded by informing the court that “the total number of deaths associated with the COVID-19 vaccines is more than double the number of deaths associated with all other vaccines combined since the year ….” […]
[…] was initially comfortable with the COVID-19 vaccines until he saw the VAERS reports. He also noted a shift in the way past treatments and vaccines had been responsibly […]
how may I use this data information you are supplying in supporting my discussions about the use of the covid 19 vaccines and their effects on persons taking them . Poto, copy , send to tablets etc . Thank you for all the work it takes do review and sourt this material out ,it makes easy access for all of us .
Wayne, feel free to use this data in supporting your discussions any way you wish. Just include a link to this site so others can find the original source.
thx.
I have to congratulate you on this effort. This must be one of the worst, most biased and suggestive interpretations of VAERS data I’ve ever seen. The 2021 dataset only has ~750.000 records, so how can you report a million adverse reactions from dec 2020 till present? I think it’s because you are counting the total records from the VAERS SYMPTOMS table (which has 5 symptoms per row btw…). This table has only ~75% distinct VAERS_IDs. The majority of reported events in VAERS_DATA (yes, you can download and see the data yourself here; https://vaers.hhs.gov/data/datasets.html?) has to do with the vaccines not being stored or handled properly. Symptom text such as ‘Error: Improper Storage (temperature)’ or ‘Vaccinated with vial that might have had a temperature excursion’ is the most frequent reported event.
The number of deaths in the 2021 data set is just over 10.000 for ALL VACCINES. So reporting over 21.000 just for COVID-19 vaccines is just plain wrong. This is disinformation at its finest.
I’ll congratulate you on getting me to respond, as I hardly have time to respond to individual comments these days. However, more importantly, I’ll congratulate you on being incorrect on every claim you have made and also on your lackluster attempt to find the truth. You looked at the 2021 dataset only, which yes, contains 748691 records, of which 737023 are for covid. You failed to recognize that there is a large file called nondomesticvaersdata.csv which contains another 340656 covid records for 2021 and 144 covid records for 2020. Add that to the 10737 covid domestic records from 2020 and you get 1088560. So sorry, NO, it is not b/c I am counting the total records from the vaers symptoms file. Lastly, the majority of reported events in VAERS are NOT for things like improper storage/handling or temperature excursions. That is an incorrect claim as well. Actually, only about 1.4% of the covid VAERS records make the claim of product storage or temperature excursion errors. If I also include product expiry issues, which you did NOT mention, that number rises to 2.5%.
Come back and try again after you’ve studied the data for more than 15 minutes, OK?
[…] VAERS Analysis […]