Since the CDC has chosen egregious dereliction of duty in not performing the weekly PRR Analysis as specified in their VAERS Standard Operating Procedure document of Jan 29, 2021, it will be provided weekly here instead.
Using the CDC’s methodology to perform the PRR Safety Signal analysis, the Covid-19 vaccines will be compared to all other vaccines combined, and then also separately compared to the Flu vaccine and the Shingles vaccine, as suggested in their document. The analysis will include Adverse Events of Special Interest (as defined by the CDC), in addition to other select adverse events that are also of high interest. The analysis will include stratifications by age and by seriousness. The time frame for analysis will be 12/2020 to present for the Covid-19 vaccines, and 1990 to present for all the other vaccines. We will be using US data only. Corrections have been made for missing age and death data (over 20% of records are missing age data which is clearly available in the narrative description) for this analysis.
This week’s PRR Analysis uses the VAERS data files released on 8/18/2023 (data through 8/11/2023).
Graphical High-Level Summary:
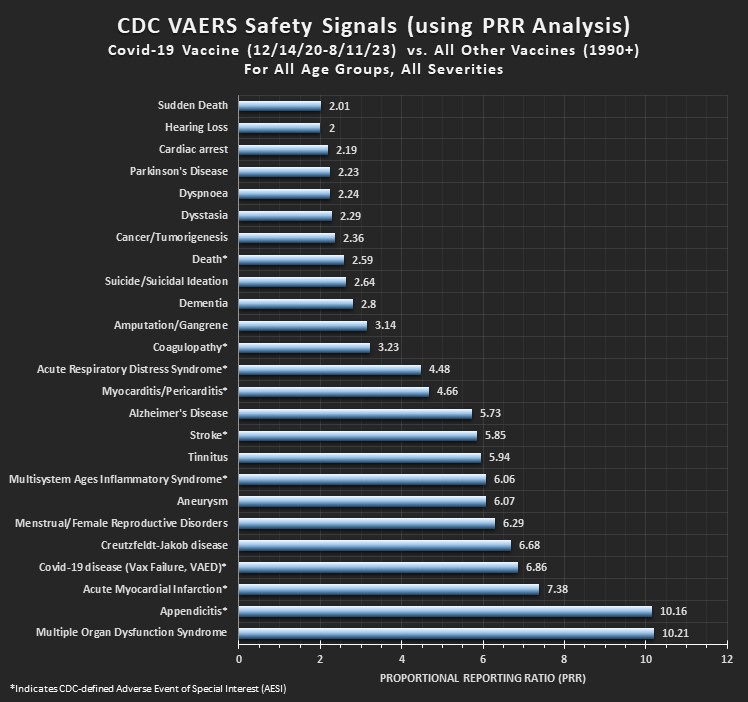
For Covid-19 Vaccines vs. NonCovid-19 vaccines:
For Covid-19 Vaccines vs. Flu Vaccines:
For Covid-19 Vaccines vs. Shingles Vaccines:
Thank you for your steadfast diligence in doing this work. Appalled that other commenters are using this memorial to the lives lost and devastated, to post about their money-making schemes. People have lost their hearts and minds to the agendas of Mammon, Moloch, and Baal.
There appears to be errors in your VAERS post contained in the following link (
vaccines-combined/ ) .
1…the first chart has the ” All other Vaccines ..” ascribed to the wrong color ( data series ).
2. More substantively , adding up adverse events ( 51 diseases summed ) for mNRA vaccines results in the sum of 1,295,081 adverse events which closely matches 1,494,382 adverse events reported by VAERS for 2021-23.
But, the same additions for All Other Vaccines amounts to 322,463 adverse events versus 794,168 adverse events reported by VAERS for the historical period .
Obviously, if correct, this error has a huge impact on the adverse event lethality ratio for the various diseases .
Please consider and correct as necessary .
In doing so, I would suggest that the period comparison be restricted to 2006 onwards for traditional vaccines .
This would mitigate potential changes in VAERS reporting rates which imo are present for the period prior to 2006.
In addition , you have the total doses administered and deaths per dose by vaccine already calculated for that period which converts both data sets to easier interpretation .
There appears to be errors in your VAERS post contained in the following link (
vaccines-combined/ ) .
This is a seminal document which , if these increased disease incidence ratios are confirmed , mean that there is little chance of the afflicted population ( in this case the US mNRA vaccinated population ) surviving based on any other animal population disease profiles
1…the first chart has the ” All other Vaccines ..” ascribed to the wrong color ( data series ).
2. More substantively , adding up adverse events ( 51 diseases summed ) for mNRA vaccines results in the sum of 1,295,081 adverse events which closely matches 1,494,382 adverse events reported by VAERS for 2021-23.
But, the same additions for All Other Vaccines amounts to 322,463 adverse events versus 794,168 adverse events reported by VAERS for the historical period .
Obviously, if correct, this error has a huge impact on the adverse event lethality ratio for the various diseases .
Also, the incidence numbers by disease in the accompanying documents for may 2023 do not match those in the charts displaying the incidence increase factors .
For example , for May 2023 , strokes in the disease table shows 25432 cases for mNRA and 1052 cases for All other vaccines combined while the chart for strokes shows 25569 cases for mNRA but 1441 cases for all other vaccines combined ….a quite different ratio
Please consider and correct as necessary .
In doing so, I would suggest that the period comparison be restricted to 2006 onwards for traditional vaccines .
This would mitigate potential changes in VAERS reporting rates which imo are present for the period prior to 2006.
In addition , you have the total doses administered and deaths per dose by vaccine already calculated for that period which converts both data sets to easier interpretation .