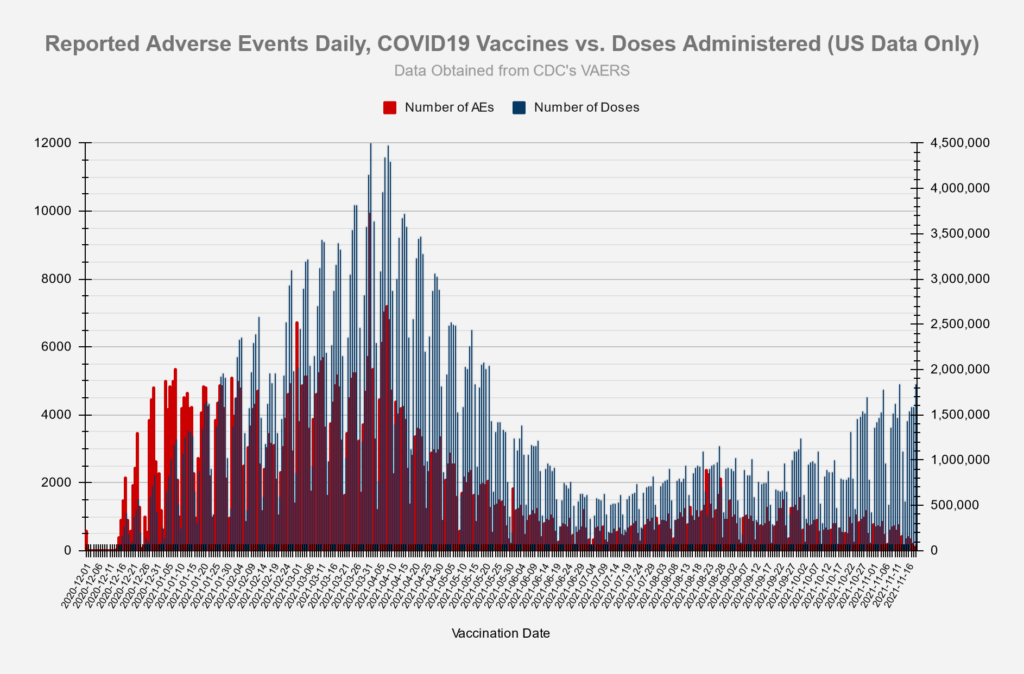
All charts and tables below reflect the data release on 11/29/2021 from the VAERS website, which includes U.S. and foreign data, and is updated through: 11/19/2021
| High-Level Summary | COVID19 vaccines (Dec’2020 – present) | All other vaccines 1990-present | US Data Only COVID19 vaccines (Dec’2020 – present) | US Data Only All other vaccines 1990-present |
|---|---|---|---|---|
| Number of Adverse Reactions | 913,268 | 857,017 | 664,745 | 747,775 |
| Number of Life-Threatening Events | 21,582 | 14,113 | 10,223 | 9,848 |
| Number of Hospitalizations | 97,561 | 81,699 | 41,501 | 38,608 |
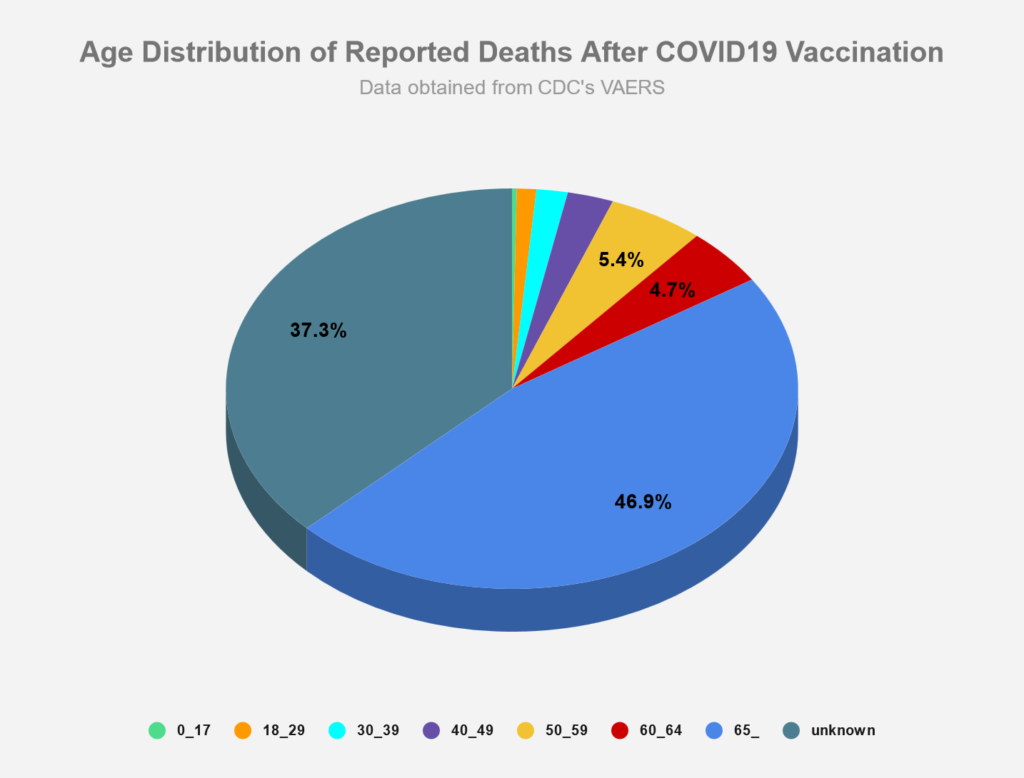
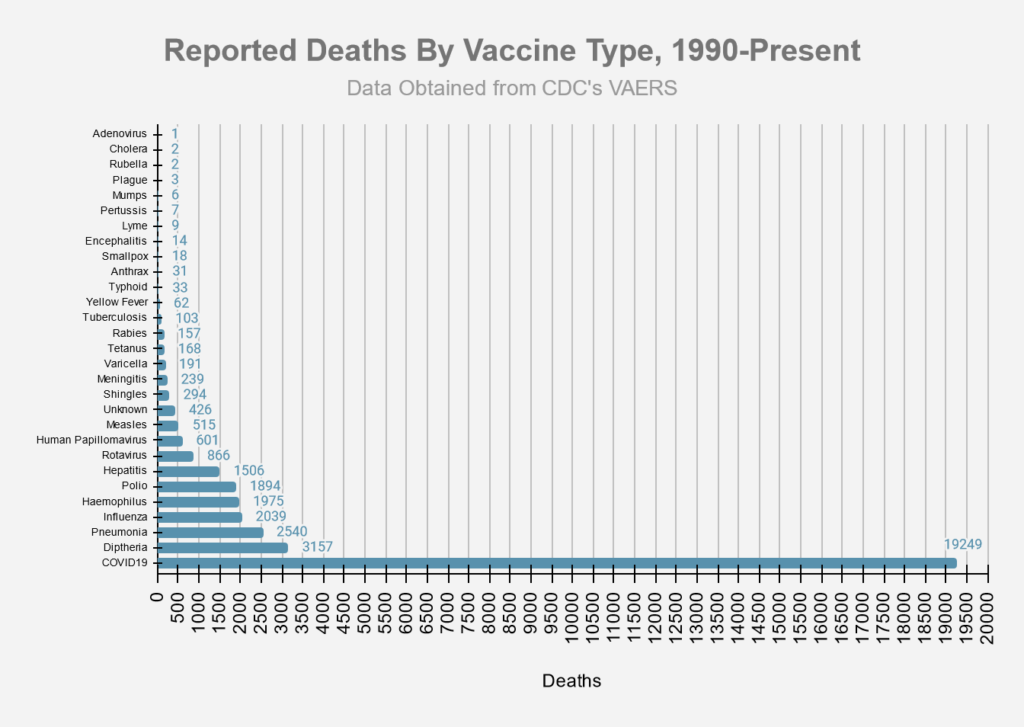
| Number of Deaths | 19,249* | 9,286 | 8,898 | 5,199 |
| # of Permanent Disabilities after vaccination | 30,967 | 20,387 | 10,232 | 12,702 |
| Number of Office Visits | 143,275 | 47,797 | 128,111 | 45,912 |
| # of Emergency Room/Department Visits | 101,315 | 211,713 | 83,101 | 202,367 |
| # of Birth Defects after vaccination | 671 | 172 | 391 | 98 |
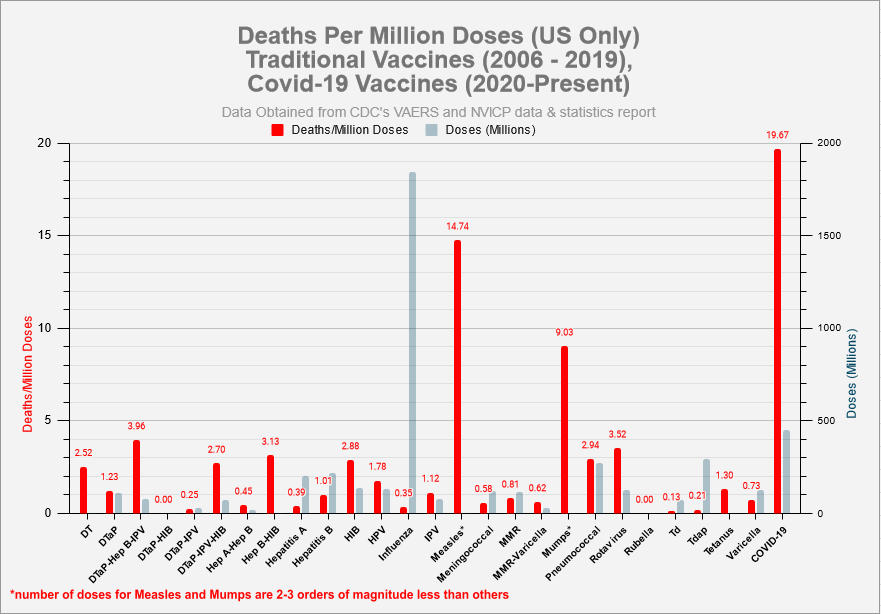
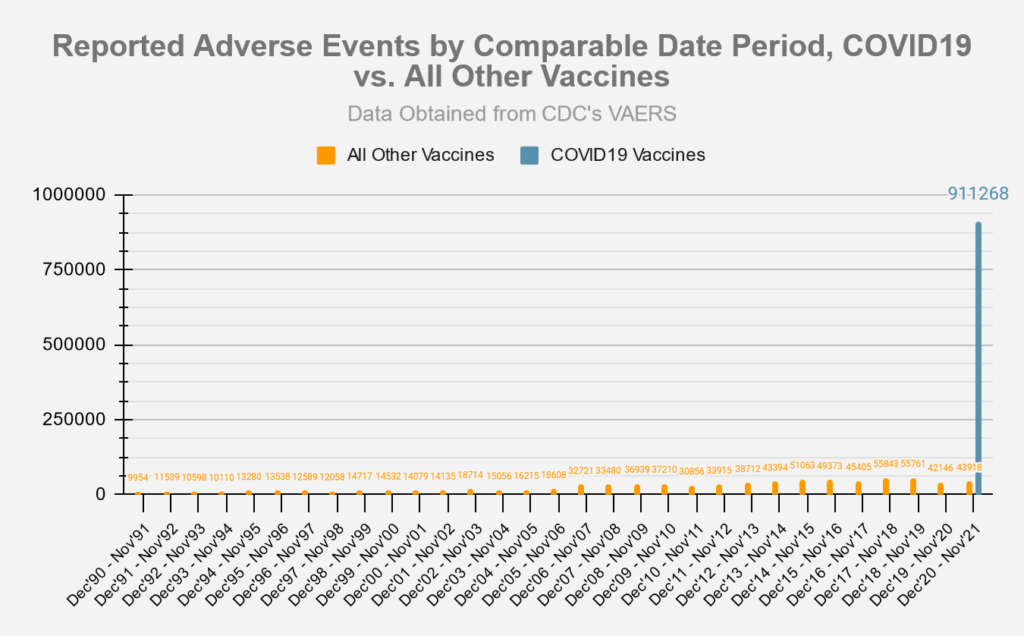
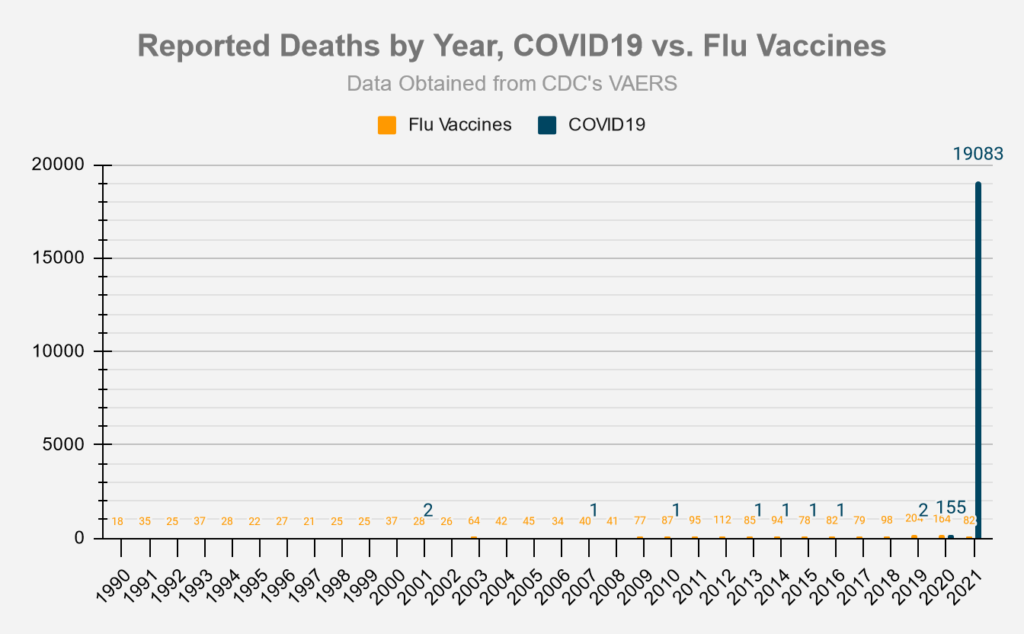
Deaths
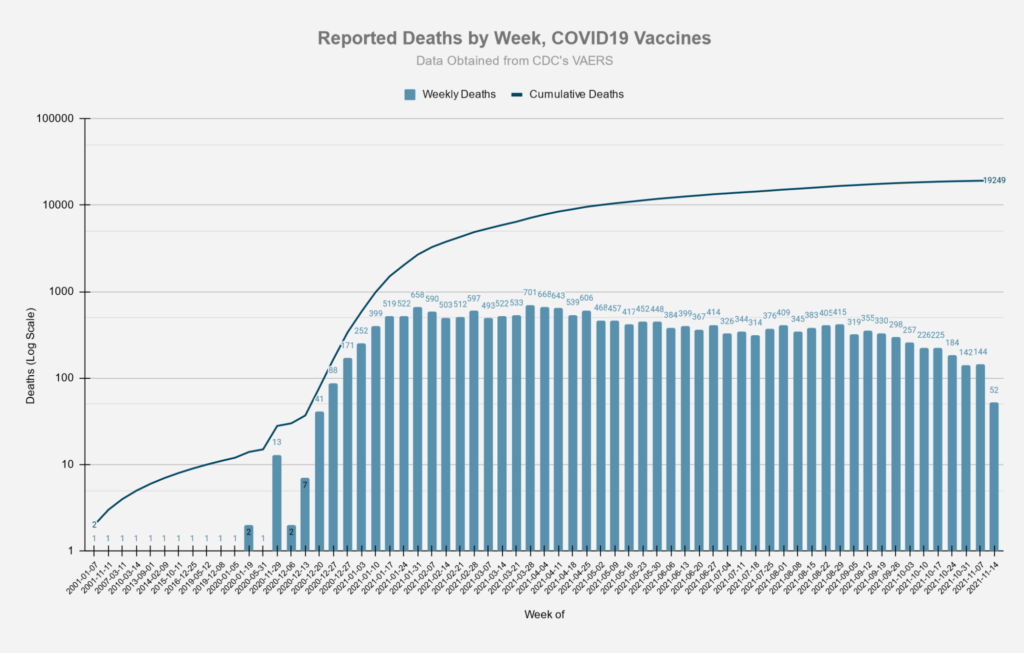
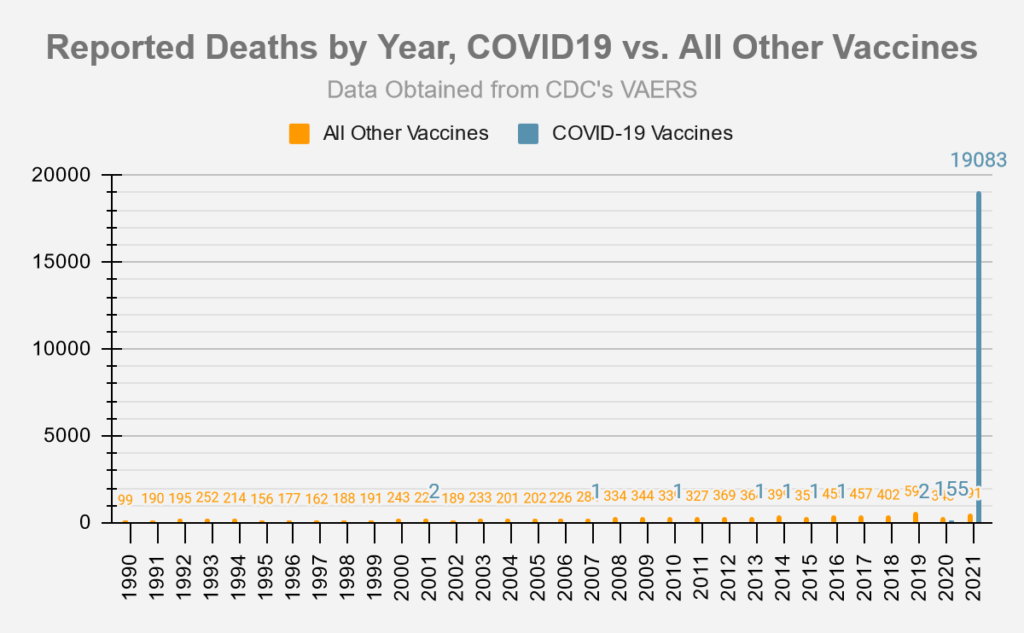

Chart using comparable 11 month periods, since Covid-19 vaccines have only been available for approximately 11 months:

Adverse Events
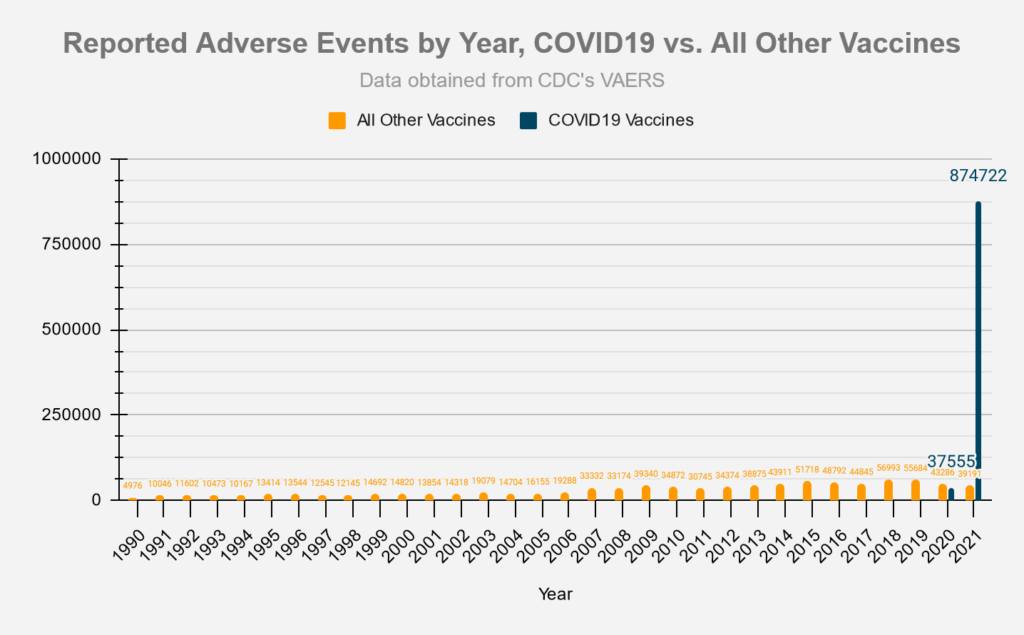
Chart using comparable 11 month periods, since Covid-19 vaccines have only been available for approximately 11 months:
Symptoms
The slide below was taken from an FDA document from October 22, 2020 and provides a list of possible adverse event outcomes related to the Covid-19 vaccines.
- Source: ‘Vaccines and Related Biological Products Advisory Committee October 22,2020 Meeting Presentation”.
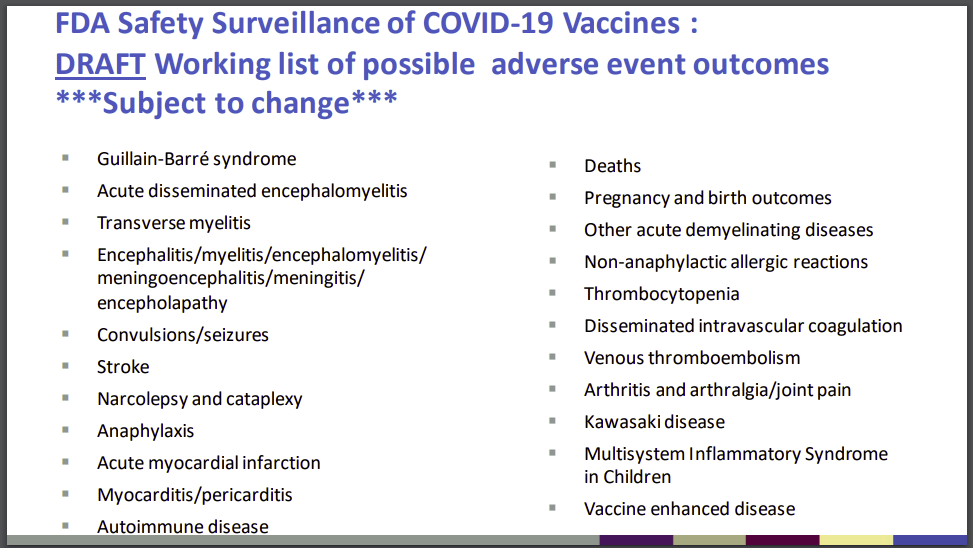
The following table lists the number of adverse events found in the VAERS data which match the outcomes listed above:
| FDA Listed Symptom | Total (Non-Lethal) Adverse Events | Total Deaths |
|---|---|---|
| Guillain-Barre | 1769 | 32 |
| Acute Disseminated Encephalomyelitis | 123 | 3 |
| Transverse Myelitis | 310 | 2 |
| Encephalitis | 1445 | 146 |
| Convulsions/Seizures | 11526 | 334 |
| Stroke | 10946 | 987 |
| Narcolepsy, Cataplexy | 230 | 4 |
| Anaphylaxis | 39606 | 155 |
| Acute Myocardial Infarction (Heart Attack) | 3158 | 965 |
| Myocarditis/Pericarditis | 11449 | 144 |
| Autoimmune Disease | 1008 | 19 |
| Other Acute Demyelinating Diseases | 231 | 3 |
| Pregnancy and birth outcomes (Miscarriages) | 2880 | 84 |
| Other Allergic Reactions | 1729 | 3 |
| Thrombocytopenia | 3899 | 291 |
| Disseminated Intravascular Coagulation | 169 | 51 |
| Venous Thromboembolism | 16842 | 927 |
| Arthritis and Arthralgia/Joint Pain | 59827 | 174 |
| Kawasaki Disease | 44 | 1 |
| Systemic Inflammatory Response Syndrome | 527 | 39 |
Vaccination Related Risks of COVID19 Vs. Flu
These set of figures compare the COVID19 vaccine to the traditional Flu vaccines. ‘Risk of Death’ percentages depend on the ‘# of Vaccinations’ data, which is only approximate, and was pulled from the CDC’s report on Flu vaccination coverage for the 2019-2020 season, and from Our World in Data for the COVID19 vaccinations.
Covid19 vaccinations through 5/31/2021 vs. Flu vaccinations 7/1/2019 – 5/31/2020 (last complete flu season)
| Vaccine Type | # of Vaccinations[3] | # of Deaths | Risk of Death | Percentage | Deaths/Mill. Vaccinations[3] |
|---|---|---|---|---|---|
| Flu | 167,447,642[1] | 32 | 1 in 5,232,739 | 0.000019% | .19 |
| COVID19 | 167,733,972[2] | 5,571 | 1 in 30,108 | 0.003321% | 33.21 |
| Vaccine Type | # of Vaccinations[3] | # of Adverse Reactions | Risk of Adverse Reaction | Percentage | AEs/Mill. Vaccinations[3] |
|---|---|---|---|---|---|
| Flu | 167,447,642 | 9,707 | 1 in 17,250 | 0.005797% | 57.97 |
| COVID19 | 167,733,972 | 528,165 | 1 in 318 | 0.3149% | 3,149 |
[1] number of flu vaccinations based on estimated flu vaccine coverage data from CDC and estimated population data from US Census. Yearly flu vaccination data covers a period of time from 7/1 to 5/31 of the following year.
[2] number of covid19 vaccinations based on estimates from Our World in Data [2] number of covid19 vaccinations based on estimates from Our World in Data
[3] Persons vaccinated with at least one dose.
Vaccine Data by Manufacturer
| Manufacturer | # of Deaths | % Deaths | Average Deaths/Day | # US Deaths | US Doses Administered | Average US Deaths/Mill. Doses | Days since EUA approval | EUA Approval Date- |
|---|---|---|---|---|---|---|---|---|
| Janssen (JNJ) | 1575 | 8.18% | 5.92 | 1018 | 16,597,641 | 61.33 | 266 | 2/26/2021 |
| Moderna | 4746 | 24.64% | 14.13 | 3749 | 175,430,932 | 21.37 | 336 | 12/18/2020 |
| Pfizer/Biontech | 12867 | 66.8% | 37.51 | 4100 | 266,730,650 | 15.37 | 343 | 12/11/2020 |
| Unknown | 73 | 0.38% | 39 | 475,568 |
| Manufacturer | # of AEs | % AEs | Average AEs/Day | # US AEs | US Doses Administered | Average US AEs/Mill. Doses | Days since EUA approval | EUA Approval Date |
|---|---|---|---|---|---|---|---|---|
| Janssen (JNJ) | 68818 | 7.52% | 258.71 | 59814 | 16,597,641 | 3603.77 | 266 | 2/26/2021 |
| Moderna | 340302 | 37.21% | 1012.8 | 307879 | 175,430,932 | 1754.99 | 336 | 12/18/2020 |
| Pfizer/Biontech | 503448 | 55.05% | 1467.78 | 296649 | 266,730,650 | 1112.17 | 343 | 12/11/2020 |
| Unknown | 2002 | 0.22% | 1506 | 475,568 |
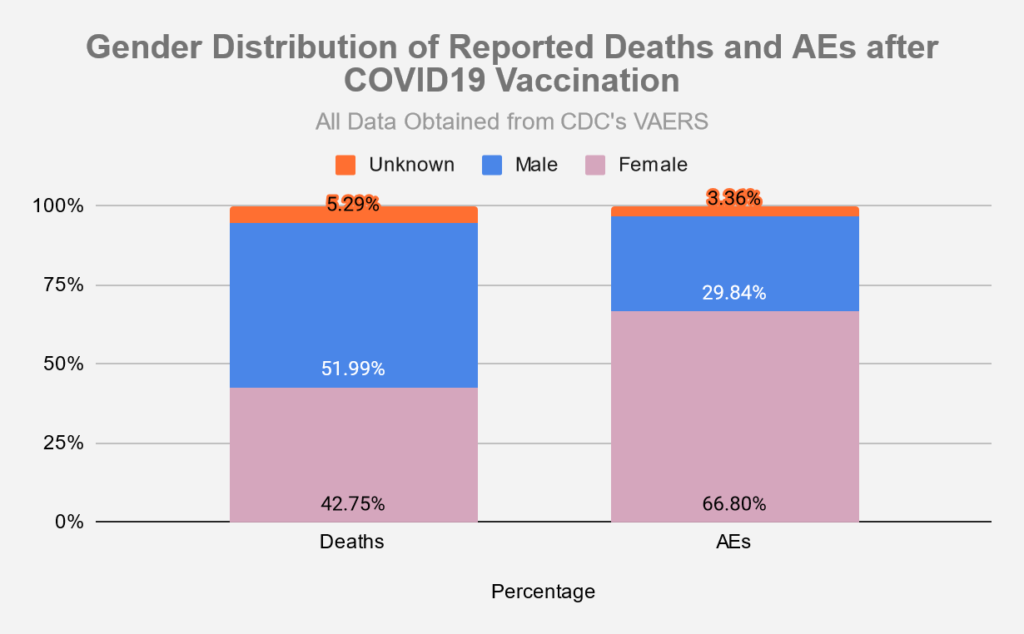
Vaccine Data by Gender
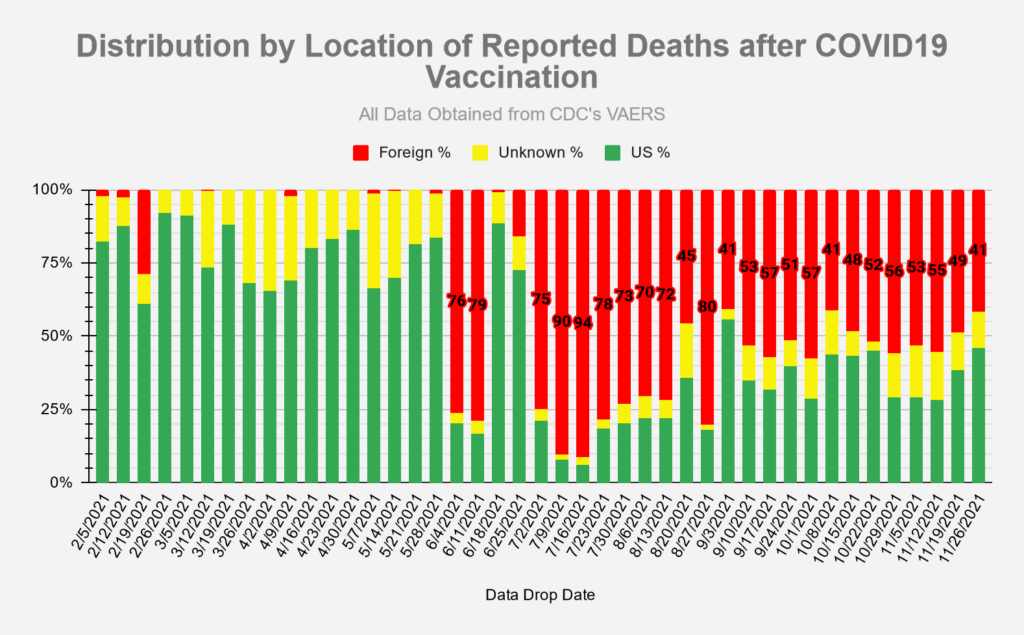
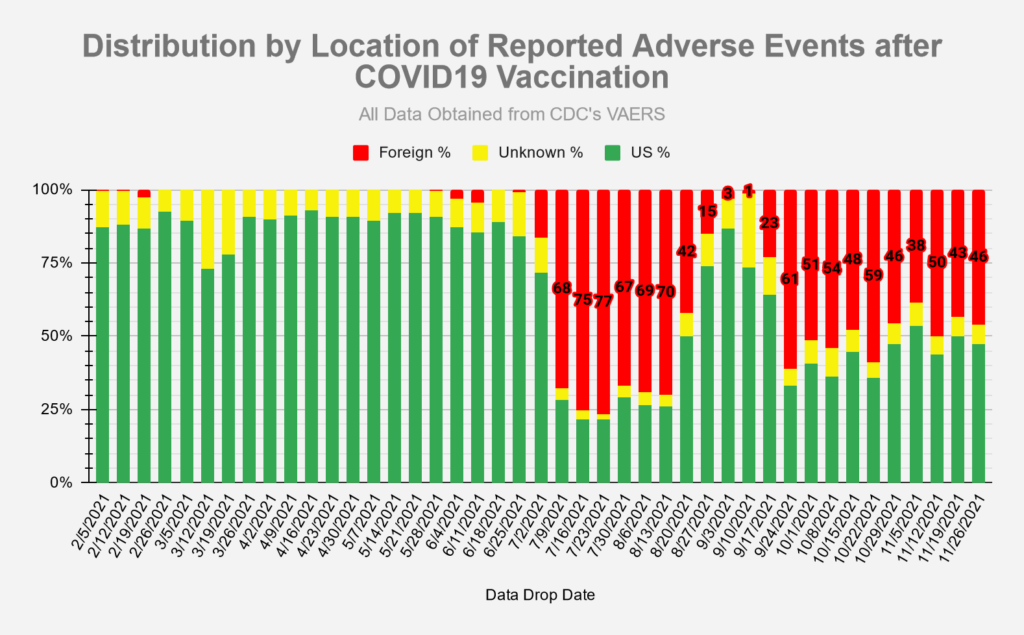
Vaccine Data by Location
Recall History
Sources
- Vaccine data (Covid-19 and other vaccines) taken from CDC’s VAERS website, located here: https://vaers.hhs.gov/data/datasets.html. VAERS data sets in the form of csv files are pulled down weekly and put into a database for reporting/analysis. Data files are available all the way back to 1990.
- Number of doses distributed for other vaccines found in NVICP Data and Statistics report here: https://www.hrsa.gov/sites/default/files/hrsa/vaccine-compensation/data/data-statistics-report.pdf
- Numbers for Covid-19 vaccines administered by manufacturer found here: https://covid.cdc.gov/covid-data-tracker/#vaccinations_vacc-total-admin-rate-total
- Numbers for total Covid-19 vaccine doses administered found here: https://data.cdc.gov/Vaccinations/COVID-19-Vaccination-Trends-in-the-United-States-N/rh2h-3yt2
- Numbers for Flu vaccine doses administered for 2019-2020 season found here: https://www.cdc.gov/flu/fluvaxview/coverage-1920estimates.htm
- Numbers for FDA regulated drugs taken from FDA’s FAERS website, located here: https://www.fda.gov/drugs/questions-and-answers-fdas-adverse-event-reporting-system-faers/fda-adverse-event-reporting-system-faers-public-dashboard
[…] VAERS, the Vaccine Adverse Reaction database, shows roughly one million reactions to the COVID-19 vaccines, and even children are dying as a result. In Vietnam, at least three children have died after […]
[…] VAERS summary for Covid-19 adverse reactions and deaths (updated weekly). […]
[…] year, skilled medical doctors and researchers hold aloft studies and statistics, including the recent VAERS statistics tabulating injuries and deaths to the COVID and other vaccines. They are dismissed with […]
[…] medical doctors and researchers hold aloft studies and statistics, including the recent VAERS statistics tabulating injuries and deaths to the COVID and other vaccines. They are dismissed with […]
[…] And, as evidenced by U.S. Food and Drug Administration (FDA) warnings and reports submitted to the U.S. government’s Vaccine Adverse Event Reporting System (VAERS), not a […]
[…] we saw with the swine flu in 1976. We have lost thousands in America alone. Scroll through the VAERS summary for Covid jabs, remembering this is only one percent of reported deaths or adverse […]
They report only 1% of death?? How is that possible????
[…] we saw with the swine flu in 1976. We have lost thousands in America alone. Scroll through the VAERS summary for Covid jabs, remembering this is only one percent of reported deaths or adverse […]
[…] therapeutic. And, as evidenced by U.S. Food and Drug Administration (FDA) warnings and reports submitted to the U.S. government’s Vaccine Adverse Event Reporting System (VAERS), not a […]
[…] with the swine flu in 1976. We have lost thousands in America alone. Scroll through the VAERS summary for Covid jabs, remembering this is only one percent of reported deaths or adverse effects. […]
my son (43) was diagnosed with pancreatitis. He does not drink or smoke. Would be consider obese.
Has been double vax’d, not sure about booster. As of this am, told his pancreous showed 50% of his pancreous
is necrotic.
Last week through imaging there was a small amount of necrosis.
Was told it might have been from a a gallstone that got hung up somewhere. Though inspite of all the imaging they can not show any in the imaging.
He is in excruciating pain, has gone from morhine to dilauted and back I think to morphine.
Is now back on dilauted. He has an NG tube ( small bowel seems to backing up into Stomach.)
He had a feeding tube put in, told they by-passed the stomach and placed it in the colon. He was showing signs of malnutriciation. He had a kidney stone a couple years ago nothing like this before.
Am also wodering if clots or micro clots could have caused this ???
Very sorry to hear about your son. IMHO, it is certainly possible, but given his medical history, perhaps not as clear-cut. Go here and search for pancreatitis (and its variations): https://vaersanalysis.info/2021/11/24/all-the-symptoms/
You will see that while pancreatitis events are certainly elevated over what we usually see in VAERS reported for other vaccines, so are multitudes of other symptoms; this particular symptom isn’t in the top 1000 symptoms on the list. Best bet is to seek medical advice from a doc who understands and is sympathetic to covid vax injuries.
[…] Résumé VAERS pour les vaccins COVID-19 jusqu’au 19/11/2021https://vaersanalysis.info/2021/12/01/vaers-summary-for-covid-19-vaccines-through-11-19-2021/ […]
[…] 19.11.2021 TARİHİNE KADAR AŞI YAN ETKİ RAPORU […]
These Scumbags pushing this experimental death shot know exactly whats going on its a plan for Global depopulation, anyone who disagrees with the facts is helping to perpetrate the lie and are guilty also, bring back the death penalty!
[…] since the symptoms are being reported as mild.? He was then asked, with more than 1.3 million reported adverse reactions to the COVID-19 vaccines, why continue to mandate them and the boosters, putting first responders at risk, especially […]
[…] LifeSiteNewsVAERSCaldron Pool […]