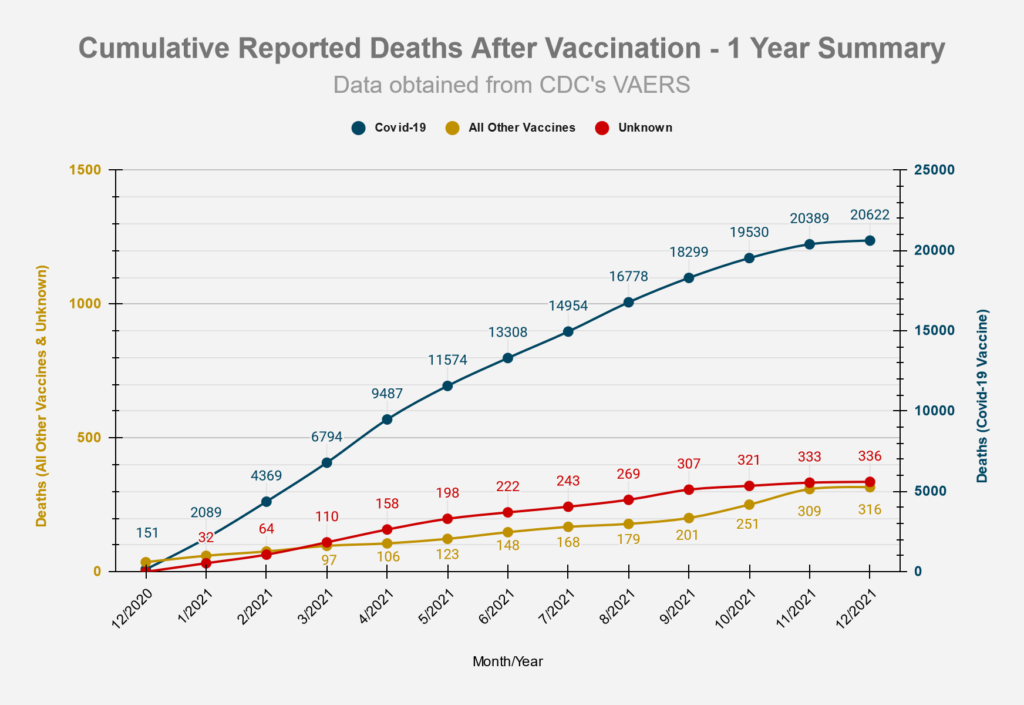
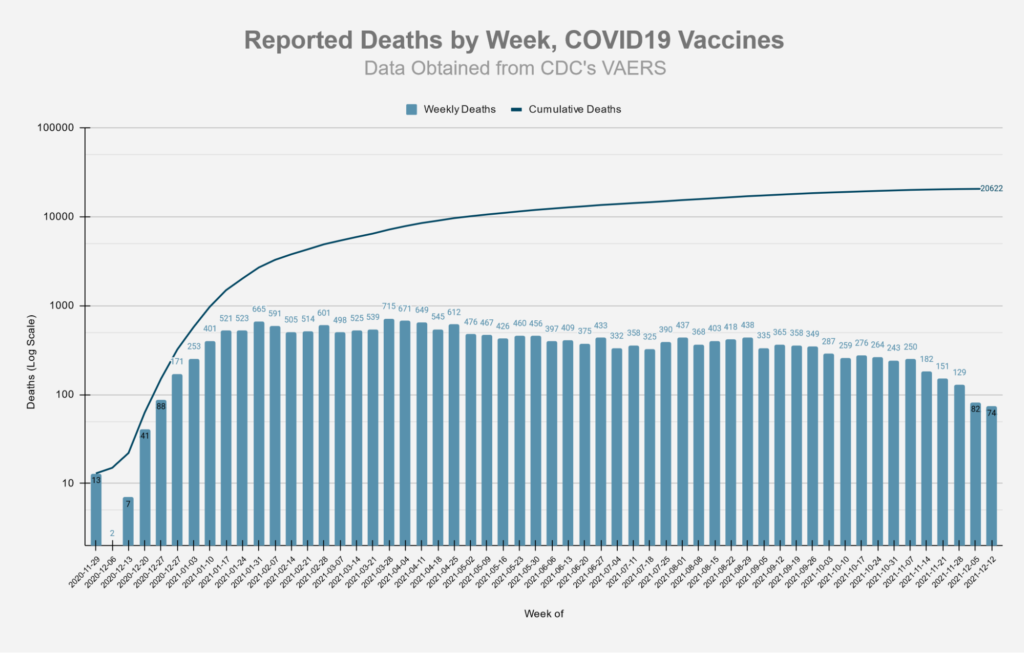
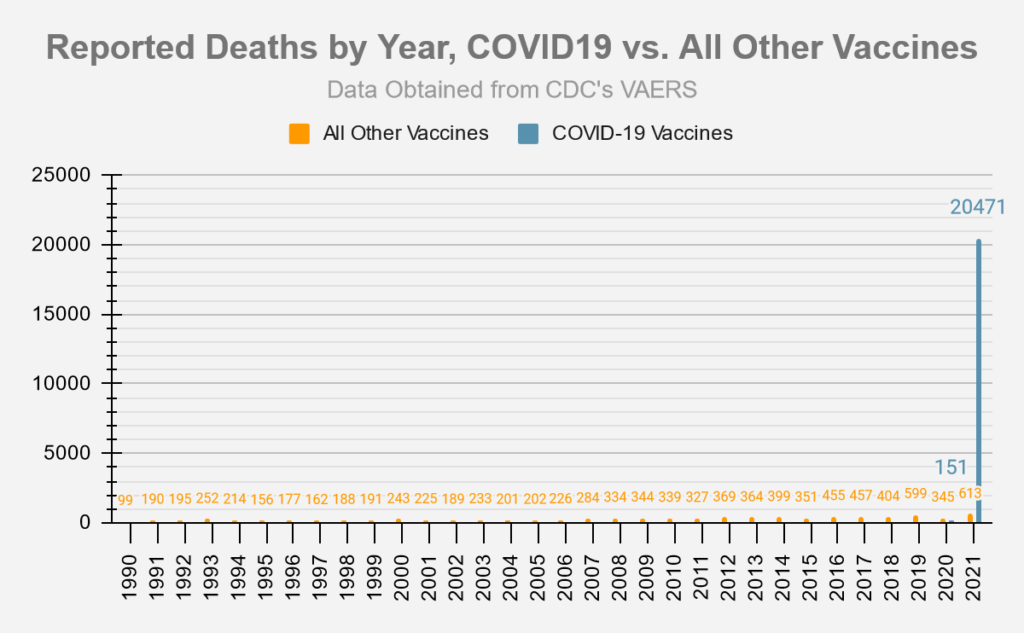
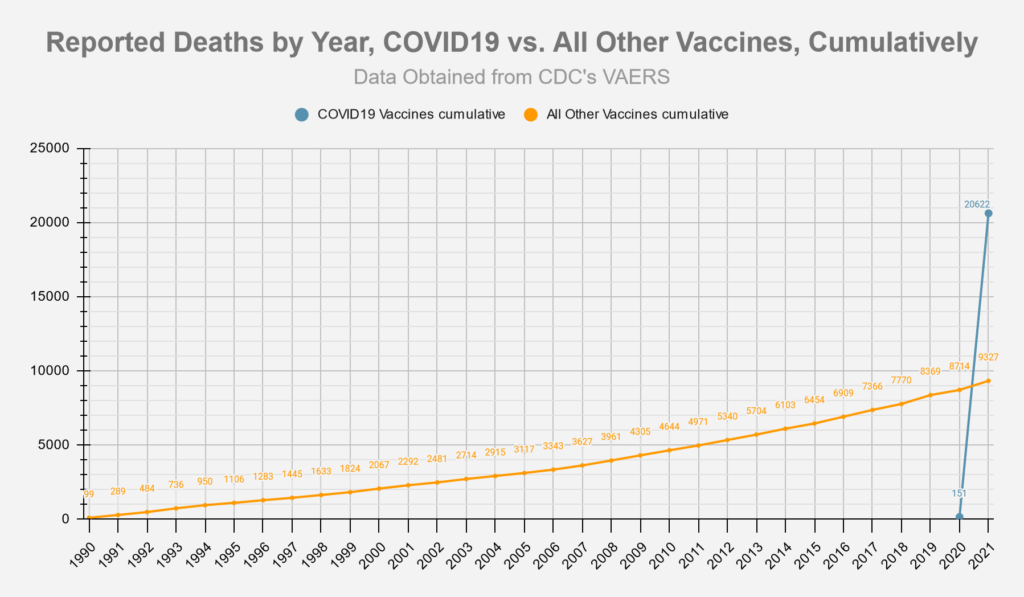
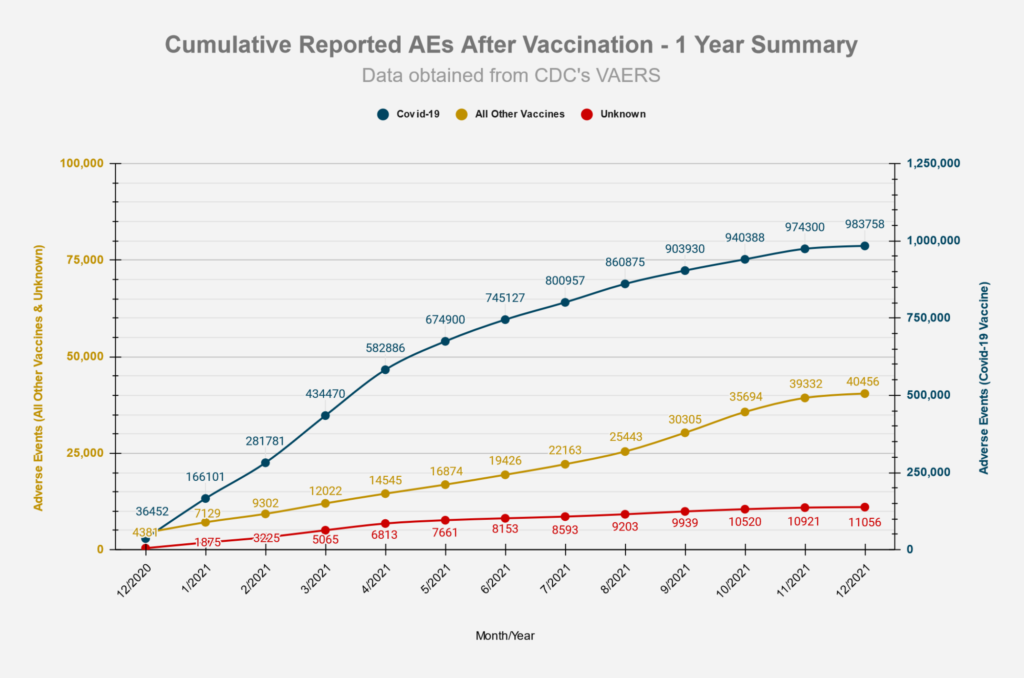
All charts and tables below reflect the data release on 12/24/2021 from the VAERS website, which includes U.S. and foreign data, and is updated through: 12/17/2021
| High-Level Summary | COVID19 vaccines (Dec’2020 – present) | All other vaccines 1990-present | US Data Only COVID19 vaccines (Dec’2020 – present) | US Data Only All other vaccines 1990-present |
|---|---|---|---|---|
| Number of Adverse Reactions | 983,758 | 864,722 | 701,127 | 752,963 |
| Number of Life-Threatening Events | 23,404 | 14,271 | 10,800 | 9,883 |
| Number of Hospitalizations | 108,572 | 82,567 | 45,251 | 38,714 |
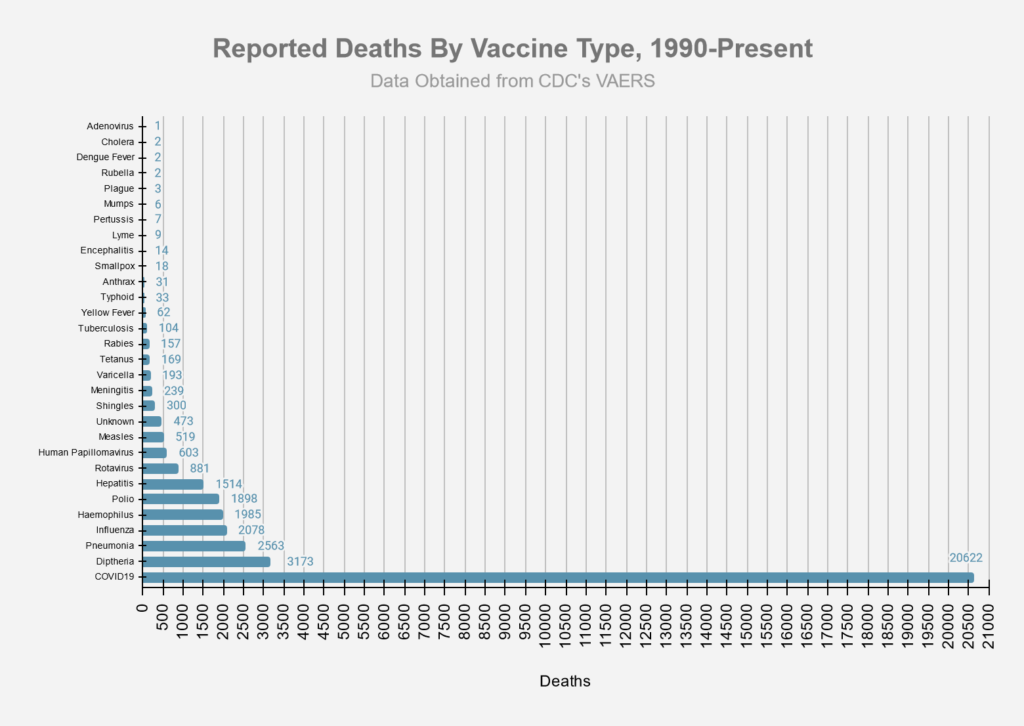
| Number of Deaths | 20,622* | 9,416* | 9,476 | 5,221 |
| # of Permanent Disabilities after vaccination | 34,615 | 20,592 | 11,045 | 12,755 |
| Number of Office Visits | 153,970 | 48,941 | 136,016 | 46,876 |
| # of Emergency Room/Department Visits | 107,785 | 212,206 | 87,198 | 202,753 |
| # of Birth Defects after vaccination | 747 | 187 | 422 | 102 |
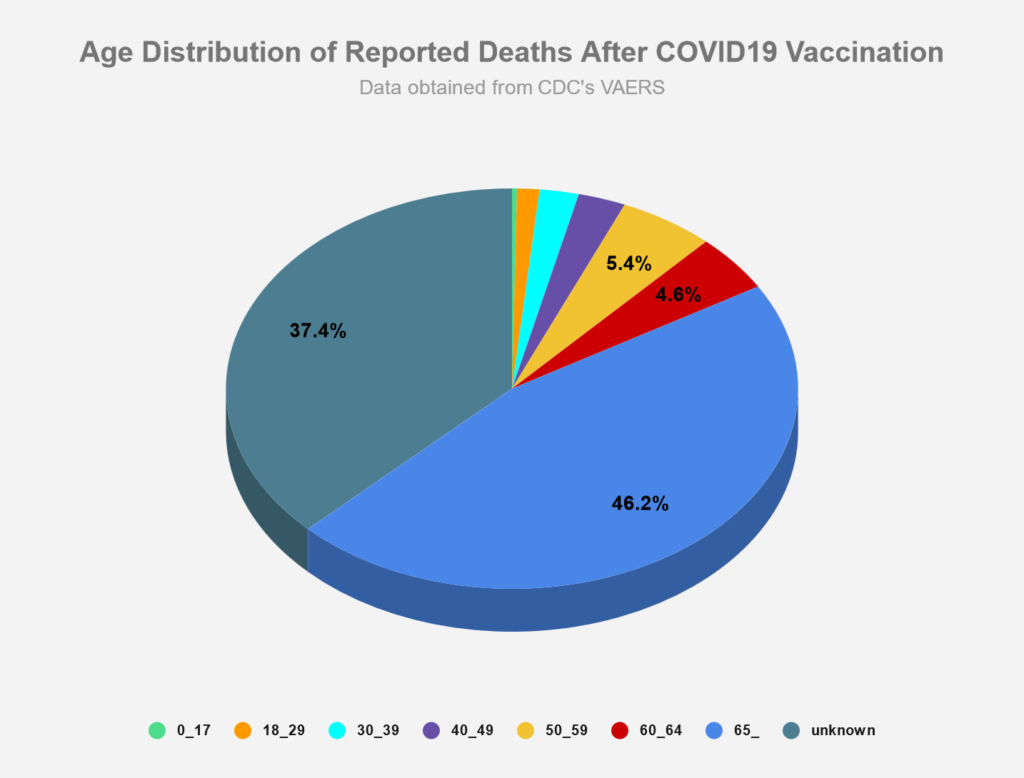
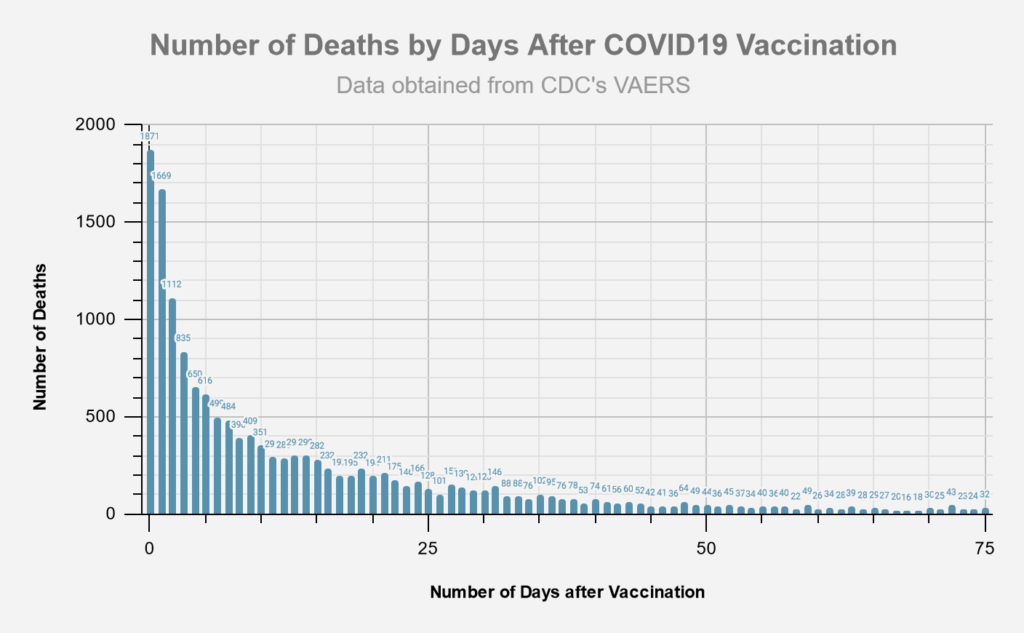
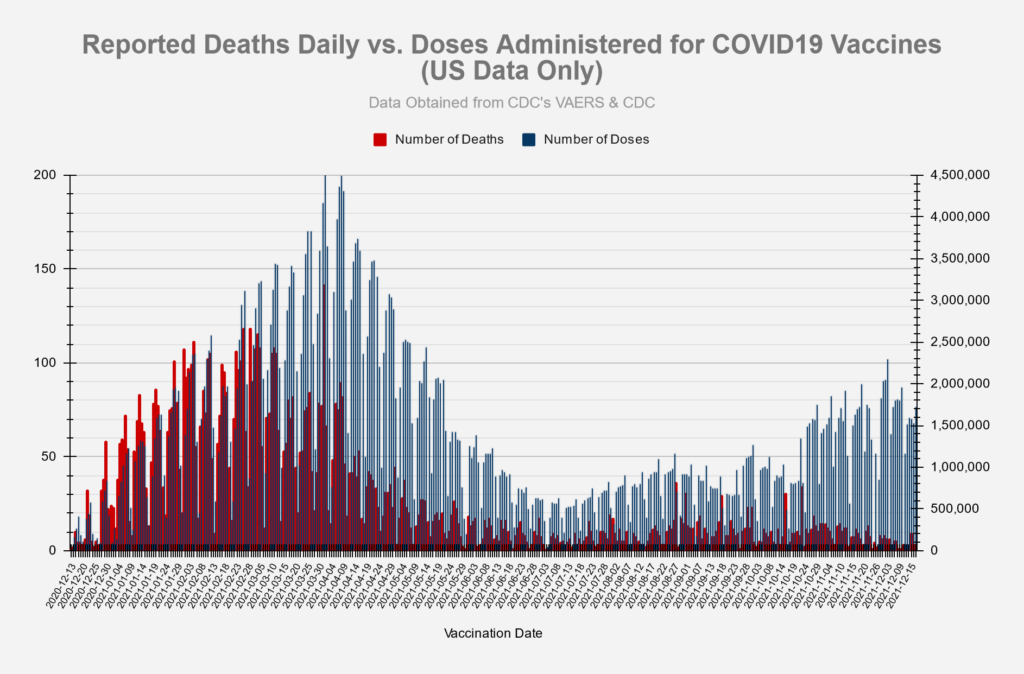
Deaths

Adverse Events

Symptoms
The slide below was taken from an FDA document from October 22, 2020 and provides a list of possible adverse event outcomes related to the Covid-19 vaccines.
- Source: ‘Vaccines and Related Biological Products Advisory Committee October 22,2020 Meeting Presentation”.
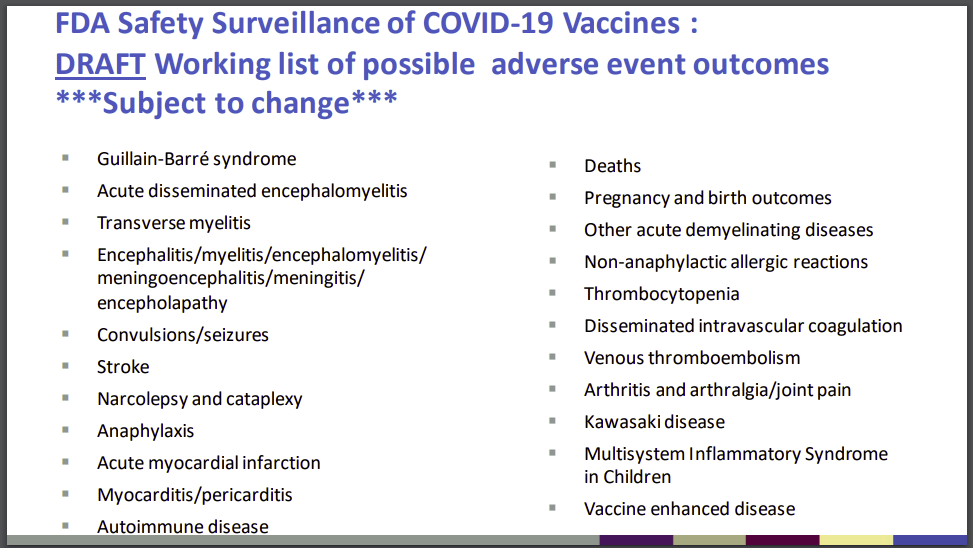
The following table lists the number of adverse events found in the VAERS data which match the outcomes listed above:
| FDA Listed Symptom | Total (Non-Lethal) Adverse Events | Total Deaths |
|---|---|---|
| Guillain-Barre | 1946 | 34 |
| Acute Disseminated Encephalomyelitis | 146 | 4 |
| Transverse Myelitis | 349 | 2 |
| Encephalitis | 1618 | 162 |
| Convulsions/Seizures | 12488 | 351 |
| Stroke | 11758 | 1056 |
| Narcolepsy, Cataplexy | 241 | 5 |
| Anaphylaxis | 41823 | 162 |
| Acute Myocardial Infarction (Heart Attack) | 3500 | 1047 |
| Myocarditis/Pericarditis | 14118 | 164 |
| Autoimmune Disease | 1146 | 22 |
| Other Acute Demyelinating Diseases | 262 | 3 |
| Pregnancy and birth outcomes (Miscarriages) | 3175 | 100 |
| Other Allergic Reactions | 1825 | 3 |
| Thrombocytopenia | 4259 | 315 |
| Disseminated Intravascular Coagulation | 186 | 57 |
| Venous Thromboembolism | 18232 | 999 |
| Arthritis and Arthralgia/Joint Pain | 64034 | 190 |
| Kawasaki Disease | 61 | 1 |
| Systemic Inflammatory Response Syndrome | 591 | 44 |
Vaccination Related Risks of COVID19 Vs. Flu
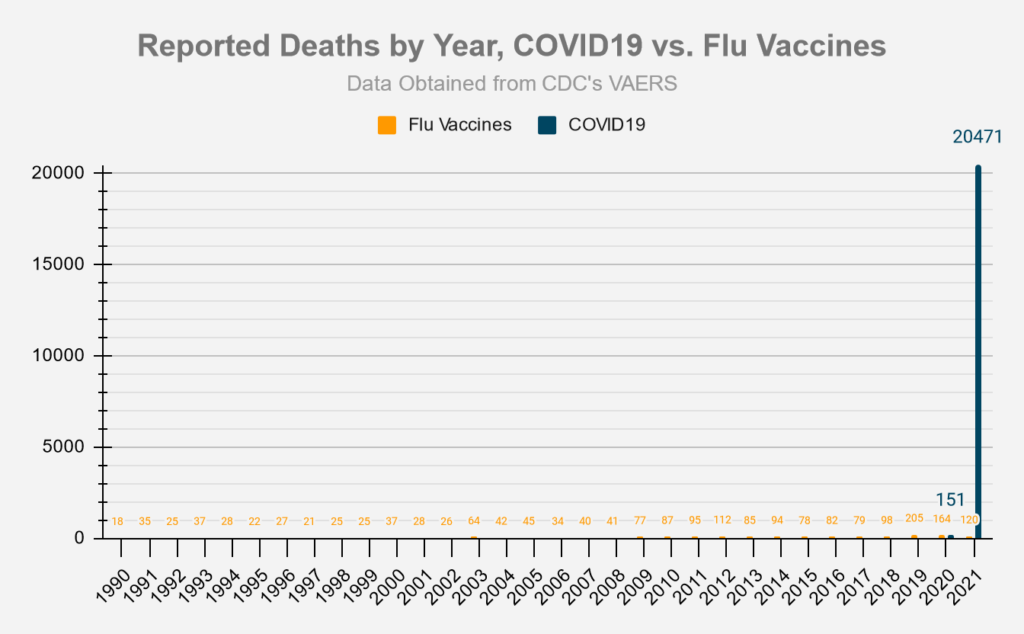
These set of figures compare the COVID19 vaccine to the traditional Flu vaccines. ‘Risk of Death’ percentages depend on the ‘# of Vaccinations’ data, which is only approximate, and was pulled from the CDC’s report on Flu vaccination coverage for the 2019-2020 season, and from Our World in Data for the COVID19 vaccinations.
Covid19 vaccinations through 5/31/2021 vs. Flu vaccinations 7/1/2019 – 5/31/2020 (last complete flu season)
| Vaccine Type | # of Vaccinations[3] | # of Deaths | Risk of Death | Percentage | Deaths/Mill. Vaccinations[3] |
|---|---|---|---|---|---|
| Flu | 167,447,642[1] | 33 | 1 in 5,074,171 | 0.000020% | .20 |
| COVID19 | 167,733,972[2] | 5,606 | 1 in 29,920 | 0.003342% | 33.42 |
| Vaccine Type | # of Vaccinations[3] | # of Adverse Reactions | Risk of Adverse Reaction | Percentage | AEs/Mill. Vaccinations[3] |
|---|---|---|---|---|---|
| Flu | 167,447,642 | 9,712 | 1 in 17,241 | 0.005800% | 58.00 |
| COVID19 | 167,733,972 | 536,125 | 1 in 313 | 0.3196% | 3,196 |
[1] number of flu vaccinations based on estimated flu vaccine coverage data from CDC and estimated population data from US Census. Yearly flu vaccination data covers a period of time from 7/1 to 5/31 of the following year.
[2] number of covid19 vaccinations based on estimates from Our World in Data [2] number of covid19 vaccinations based on estimates from Our World in Data
[3] Persons vaccinated with at least one dose.
Vaccine Data by Manufacturer
| Manufacturer | # of Deaths | % Deaths | Average Deaths/Day | # US Deaths | US Doses Administered | Average US Deaths/Mill. Doses | Days since EUA approval | EUA Approval Date- |
|---|---|---|---|---|---|---|---|---|
| Janssen (JNJ) | 1731 | 8.39% | 5.89 | 1103 | 17,501,026 | 63.02 | 294 | 2/26/2021 |
| Moderna | 5081 | 24.62% | 13.96 | 3968 | 190,891,698 | 20.79 | 364 | 12/18/2020 |
| Pfizer/Biontech | 13738 | 66.58% | 37.03 | 4373 | 291,318,945 | 15.01 | 371 | 12/11/2020 |
| Unknown | 85 | 0.41% | 40 | 510,661 |
| Manufacturer | # of AEs | % AEs | Average AEs/Day | # US AEs | US Doses Administered | Average US AEs/Mill. Doses | Days since EUA approval | EUA Approval Date |
|---|---|---|---|---|---|---|---|---|
| Janssen (JNJ) | 72852 | 7.39% | 247.8 | 62548 | 17,501,026 | 3573.96 | 294 | 2/26/2021 |
| Moderna | 361130 | 36.65% | 992.12 | 323094 | 190,891,698 | 1692.55 | 364 | 12/18/2020 |
| Pfizer/Biontech | 549089 | 55.73% | 1480.02 | 315134 | 291,318,945 | 1081.75 | 371 | 12/11/2020 |
| Unknown | 2263 | 0.23% | 1567 | 510,661 |
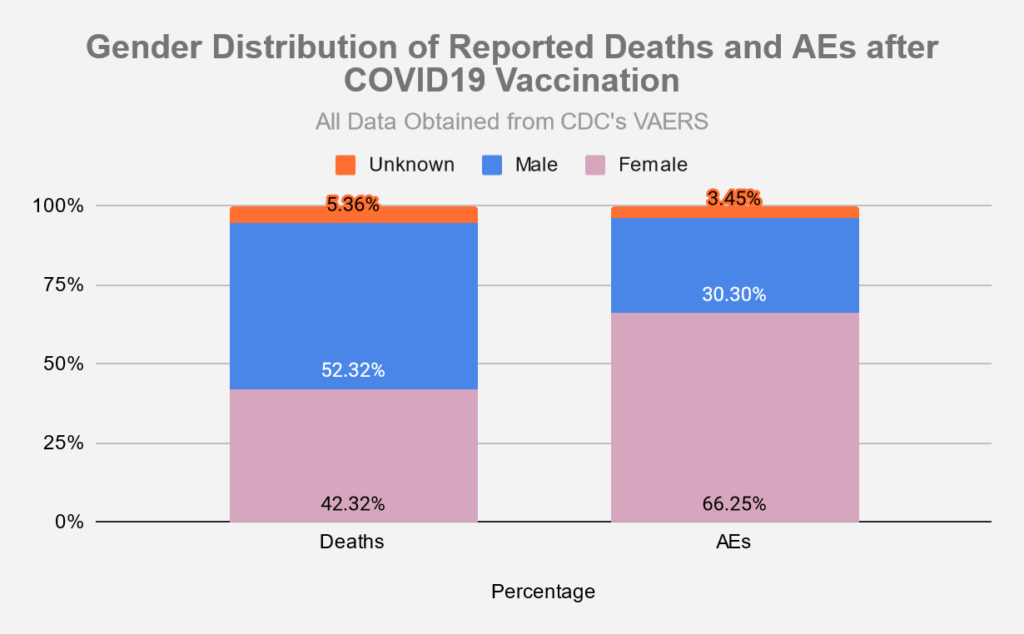
Vaccine Data by Gender
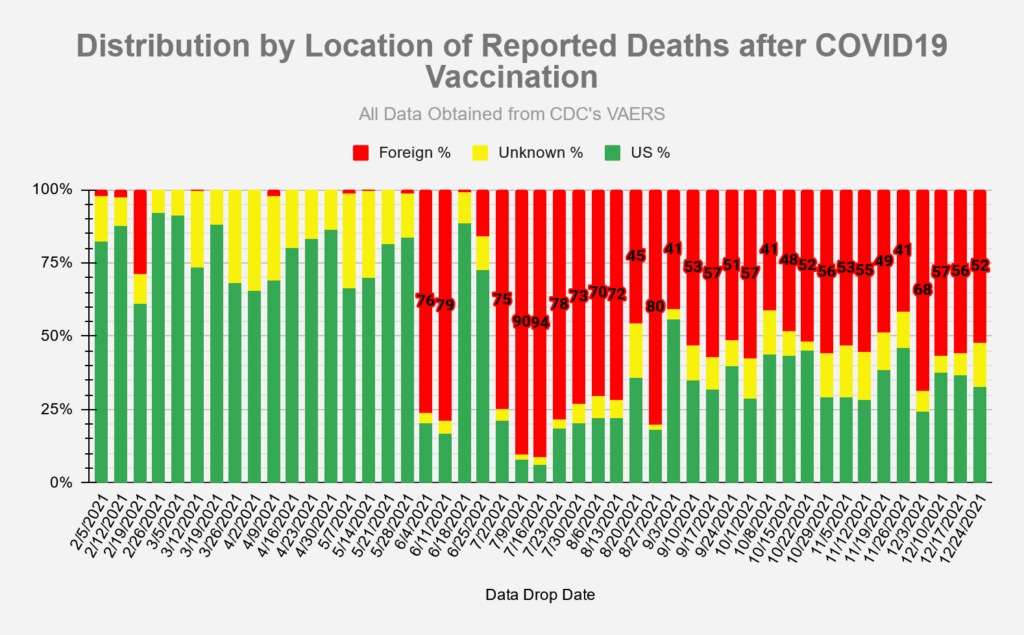
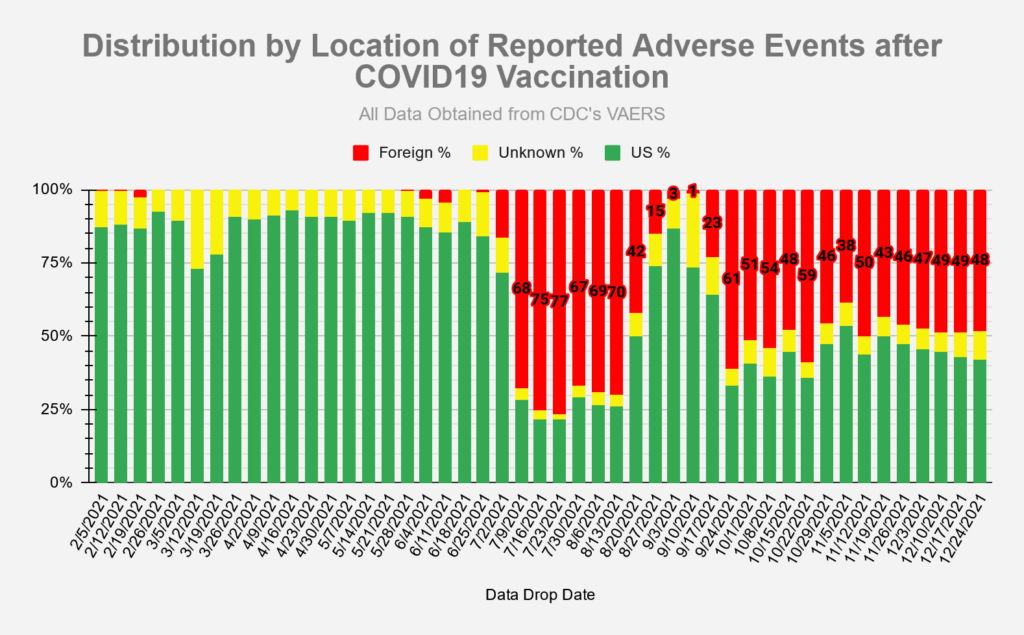
Vaccine Data by Location
Recall History
Sources
- Vaccine data (Covid-19 and other vaccines) taken from CDC’s VAERS website, located here: https://vaers.hhs.gov/data/datasets.html. VAERS data sets in the form of csv files are pulled down weekly and put into a database for reporting/analysis. Data files are available all the way back to 1990.
- Number of doses distributed for other vaccines found in NVICP Data and Statistics report here: https://www.hrsa.gov/sites/default/files/hrsa/vaccine-compensation/data/data-statistics-report.pdf
- Numbers for Covid-19 vaccines administered by manufacturer found here: https://covid.cdc.gov/covid-data-tracker/#vaccinations_vacc-total-admin-rate-total
- Numbers for total Covid-19 vaccine doses administered found here: https://data.cdc.gov/Vaccinations/COVID-19-Vaccination-Trends-in-the-United-States-N/rh2h-3yt2
- Numbers for Flu vaccine doses administered for 2019-2020 season found here: https://www.cdc.gov/flu/fluvaxview/coverage-1920estimates.htm
- Numbers for FDA regulated drugs taken from FDA’s FAERS website, located here: https://www.fda.gov/drugs/questions-and-answers-fdas-adverse-event-reporting-system-faers/fda-adverse-event-reporting-system-faers-public-dashboard
I have been trying to find someone for months who can parse and report data for us here at Keep Colorado Free & Open, and this is excellent! THANK YOU SO MUCH for doing this!
Is there a way to pull data for hospital capacities (beds) and hospitalizations by vaxx status by state and county? Deaths by vaxx status by state and county? It’s so obvious they are lying to us about this being a “pandemic of the unvaxxed” since the countries with the highest vaxx rates have 80+% COVID positive hospitalizations and deaths in the vaxxed! Yet here in the US, they want us to believe that the majority of hospitalizations deaths are in the unvaxxed! Nonsense, but we only have their adulterated data to go from! Please let me know if you can run this data too!
The cdc is tracking all of that info and then some. Here is the link to tab showing what has to be reported. https://ndc.services.cdc.gov/wp-content/uploads/COVID-19_V1_1_MMG_20210921.xlsx Form filled out from https://www.cdc.gov/ncird/surveillance/downloads/COVID-19-Surveillance-Worksheet-annotated-508.pdf . Problem is that none of the info is being made available to the public. Clearly they have what to hide. Compare the criteria for information sought with the form for Aug 2020 at https://www.hhs.gov/sites/default/files/hhs-guidance-implementation.pdf?deliveryName=DM35899
https://covid.cdc.gov/covid-data-tracker/#vaccinations_vacc-total-admin-rate-total Tells us how many vaxxed per state.
https://gis.cdc.gov/grasp/COVIDNet/COVID19_3.html Hospitalizations only tracked in 10! states, (how are they extrapolating the data for all 50?).
https://covid.cdc.gov/covid-data-tracker/#vaccinations-nursing-homes
Nursing home data, showing double vax, plus residents with booster is almost the same as the zero or one shot, and up to 13 days later rate. Clearly, the vax is worthless for nursing home population.
Also the cdc is only tracking 10% of population, the other 90% is by ratio, fabrication. https://gis.cdc.gov/grasp/COVIDNet/COVID19_5.html#virusTypeDiv See notes on the bottom of the page
On another page I saw that they monitor test positive results from 12 states, to trace data (also not the whole country).
https://covid.cdc.gov/covid-data-tracker/#covidnet-hospitalizations-vaccination Rate of confirmed cases by hospitalization only. 90%+ are over age 50, footnotes show that data is only sourced from 12 states. Rest of the numbers are likely nonsense, “figures don’t lie, but liars can figure.”
[…] Even the CDC is beginning to take note, and has written a page warning young adults that myocarditis is a known and serious symptom of the mRNA vaccines. Further, one scientist has linked the COVID-19 booster shot to parkinson’s disease. In a piece for Citizen’s Journal, Dr. Stephanie Seneff told Dr. Joseph Mercola in an interview that she found a possible link between the number of booster shots one receives and the onset of Parkinson’s di…. […]
As far as vaccinated “breakthrough cases” are concerned the CDC admitted that they are only requesting tracking for serious cases of hospitalization and deaths. “Beginning May 1, 2021, CDC transitioned from monitoring all reported COVID-19 vaccine breakthrough infections to investigating only those among patients who are hospitalized or die, thereby focusing on the cases of highest clinical and public health significance.” Check out the guidance at: https://www.cdc.gov/mmwr/volumes/70/wr/mm7021e3.htm
https://data.cms.gov/covid-19/covid-19-nursing-home-data
Scary Numbers for Nursing home deaths.
Residents deaths were approximately 1 in 5!
Staff deaths approximately 1 in 300.
Webpage has info by state, facility, vax rate, case and death count, for staff and residents.
https://download.cms.gov/covid_nhsn/covid-19%20nursing%20home%20resident%20and%20staff%20vaccination%20rates.xlsx
Nursing home info for some reason only includes states alphabetically through Indiana. Not sure where to find the rest of the data.
Blistering comprehensive internet research report alert:
Article on Massachusetts cases
https://www.masslive.com/coronavirus/2021/12/massachusetts-reports-20247-new-breakthrough-covid-cases-or-about-44-compared-to-total-cases-reported-during-same-period.html
Last week case positivity rate was 43% vaccinated, this week 44%. Definitely not the “pandemic of the unvaccinated”
In July “ https://www.cdc.gov/mmwr/volumes/70/wr/mm7031e2.htm “ Massachusetts had an outbreak with 74% vaxxed and nearly 80% of the vaxxed were symptomatic.
–
Not sure source of the study listed, but this article says that the breakthrough rate is triple for immunocompromised and they accounted for 100% of deaths after vaccination, Dec 2020 through Jul 2021.
https://medicalxpress.com/news/2021-11-breakthrough-covid-infections-severe-immunocompromised.html
Statistically, older people (mostly 65+), may be “immunocompromised” as they account for more than 90% of hospitalization and deaths among the “unvaccinated” as well.
–
I wonder if the immuno-compromises are being caused by ADE, as explained in this article: https://greatmountainpublishing.com/2021/09/01/breakthrough-cases-in-the-vaccinated-population-are-actually-symptoms-of-antibody-dependent-enhancement-caused-by-the-covid-19-vaccines/
–
Interesting quote that I found online:
https://greatmountainpublishing.com/2021/12/27/the-cdc-falsely-counts-vaccinated-covid-deaths-as-unvaccinated-covid-deaths/
In a July 16, 2021, White House press briefing, CDC director Dr. Rochelle Walensky claimed that “over 97% of people who are entering the hospital right now are unvaccinated.” A few weeks later, in an August 5, 2021, statement, she inadvertently revealed how that statistic actually came about.
As it turns out, the CDC was looking at hospitalization and mortality data from January through June 2021 — a timeframe during which the vast majority of the U.S. population were still unvaccinated.
I also found out new information, under the header “Not All Vaccinated Are Confirmed Vaccinated” that further skews the statistics.
-UK doc at: https://assets.publishing.service.gov.uk/government/uploads/system/uploads/attachment_data/file/1042367/technical_briefing-31-10-december-2021.pdf shows Cycle threshold values on page 33, showing ratios to positivity rate.
—-
Check out this internal CDC doc (from 5 months ago, the fix is in) describing breakthrough cases: https://fm.cnbc.com/applications/cnbc.com/resources/editorialfiles/2021/07/30/CDC_slides.pdf
See bolded note on the bottom of page 2, data on pgs 4, 9, 10, 12, 13, 17, 20-love the personal mask protection rate admission, (and with 50% infection rate, there will be 35% natural immunity?).
Follow up slides at: https://dreddymd.files.wordpress.com/2021/10/salus_humetrix_ve_study_2021_09_28-2.pdf especially page 6, showing breakthrough infections approaching early pandemic levels of infections for Delta, whoa! If they said that Omicron is far more contagious, I wonder what the breakthrough rate is in comparison? Especially since hospitalizations and ICU rate were very high with Delta. This shows that even with the CDC only tracking severe cases with hospitalizations, that the vaccine has a lower efficacy rate than natural immunity, with 180 day period, as seen on page 17.
-Dec 16 follow up from CDC on Omicron with preliminary data showing infections for double vax is triple the rate over Delta, and hospitalization rate is More Than 4x Delta. On page 16, you’ll see that Pfizer and Moderna are Both working on Omicron Specific boosters despite publicly stating that the current vaccines are “very effective against Omicron” and everyone should go get a vaccine if not yet and a booster, if already double vaxxed.
https://www.cdc.gov/vaccines/acip/meetings/downloads/slides-2021-12-16/06-COVID-Scobie-508.pdf
Here is one of the referenced documents https://khub.net/documents/135939561/430986542/Effectiveness+of+COVID-19+vaccines+against+Omicron+variant+of+concern.pdf/f423c9f4-91cb-0274-c8c5-70e8fad50074 This shows infection rates with excellent breakdowns on vax status determinations and periods. One caveat is that it only shows the Symptomatic case rates.
–
https://greatmountainpublishing.com/2021/10/25/how-google-hides-the-truth-about-the-dangers-of-covid-19-vaccines/
I tested it and couldn’t find the site when I typed in “vaxsafety” either.
This is the vax safety website that google pushes. https://www.aafp.org/family-physician/patient-care/current-hot-topics/recent-outbreaks/covid-19/covid-19-vaccine/safety-and-efficacy-data-overview.html
–
Also, OSHA updated their guidelines for employers. Not only are the vaccine manufacturers not liable, neither are employers any longer.
“Are adverse reactions to the COVID-19 vaccine recordable on the OSHA recordkeeping log?” https://www.osha.gov/coronavirus/faqs#employer
DOL and OSHA, as well as other federal agencies, are working diligently to encourage COVID-19 vaccinations. OSHA does not wish to have any appearance of discouraging workers from receiving COVID-19 vaccination, and also does not wish to disincentivize employers’ vaccination efforts. As a result, OSHA will not enforce 29 CFR 1904’s recording requirements to require any employers to record worker side effects from COVID-19 vaccination at least through May 2022. We will reevaluate the agency’s position at that time to determine the best course of action moving forward.
–
Last, but not least, the Johns Hopkins SPARS pandemic scenario (the parallels are scary how true they are, for a document supposedly from Oct 2017). https://www.centerforhealthsecurity.org/our-work/Center-projects/completed-projects/spars-pandemic-scenario.html I just had to check out web archives to find out if it was truly written before the plandemic. The earliest that I could find this was May 2020 https://web.archive.org/web/20200519071031/https://www.centerforhealthsecurity.org/news/center-news/2017/2017-10-23_spars-scenario.html, so fake date, or entirely faked (but such a realistic play on current events).
Interesting video analysis of Pfizer’s original study data: https://www.canadiancovidcarealliance.org/ with resource doc: https://greatmountainpublishing.com/2021/12/25/hidden-data-in-the-rigged-pfizer-covid-19-vaccine-studies-prove-its-vaccine-is-unsafe-and-ineffective/
Sorry wrong link was pasted for resource doc, correction : https://www.canadiancovidcarealliance.org/wp-content/uploads/2021/12/The-COVID-19-Inoculations-More-Harm-Than-Good-REV-Dec-16-2021.pdf
Great site. Thank you so much for doing all this work gathering and analyzing the data and making it available publicly.
[…] VAERS Summary for COVID-19 Vaccines through 12/17/2021 Posted in Adverse Event Reporting, VARES […]
[…] https://vaersanalysis.info/2021/12/25/vaers-summary-for-covid-19-vaccines-through-12-17-2021/ […]
[…] Fuentes de imágenes de datos de VAERS: https://vaersanalysis.info/2021/12/25/vaers-summary-for-COVID-19-vaccines-through-12-17-2021/ […]
[…] 17 décembre 2021, le VAERS comptabilise 2 fois plus de morts déclarées à cause de ces injections expérimentales anti covid que tous les autres vaccins confondus pendant […]
[…] SOURCE – […]
[…] VAERS Summary for COVID-19 Vaccines through 12/17/2021 – VAERS Analysis […]