About 9 weeks.
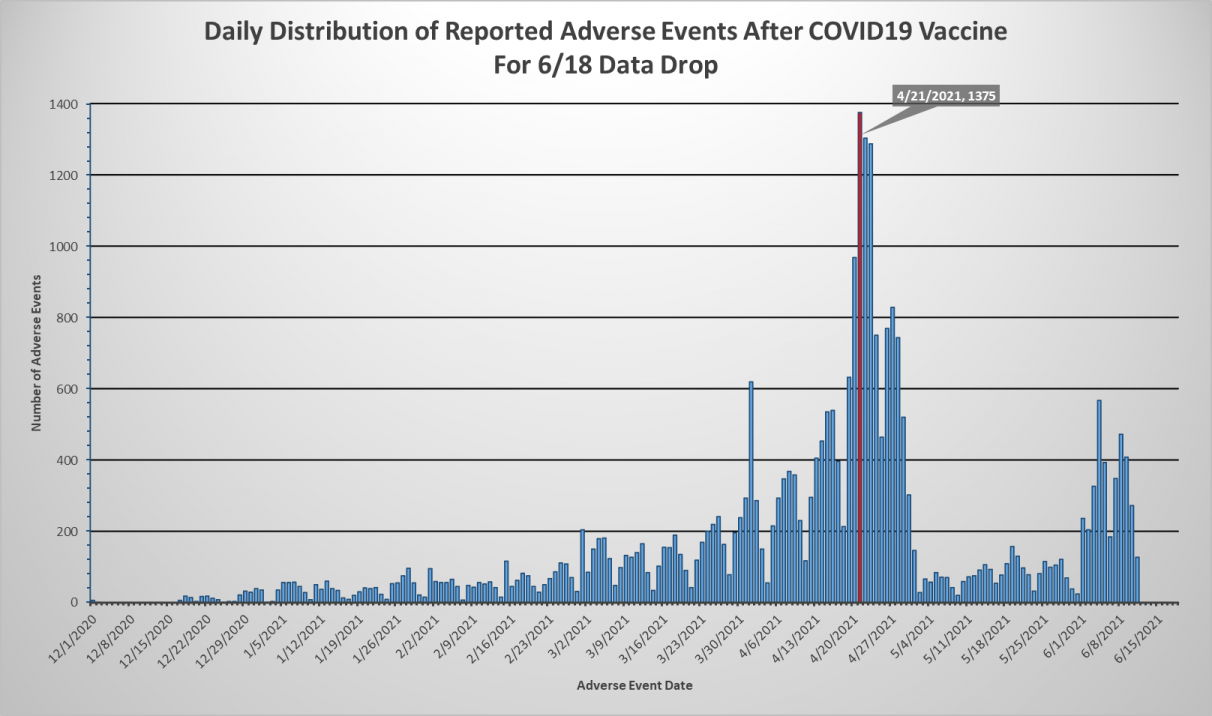
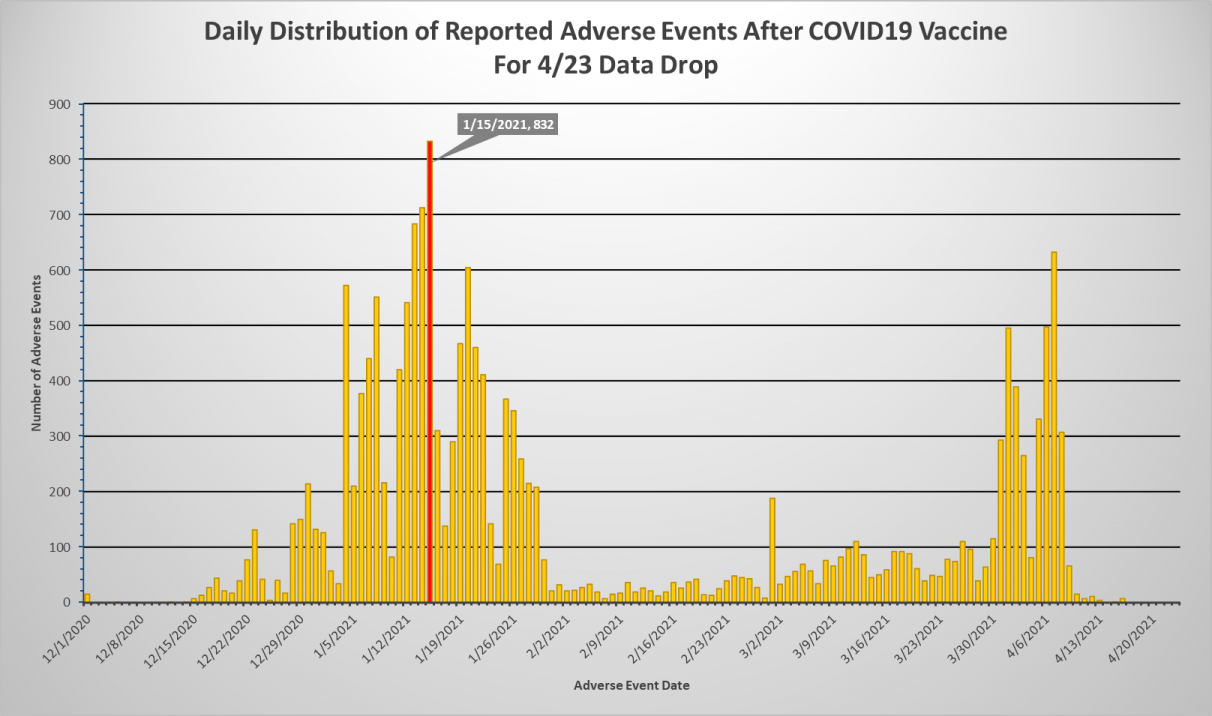
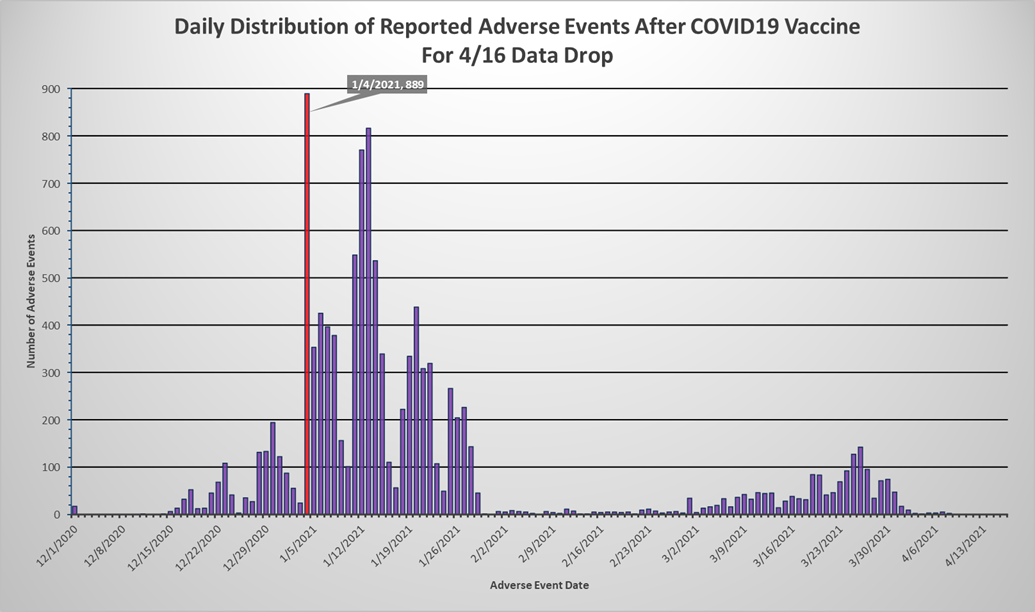
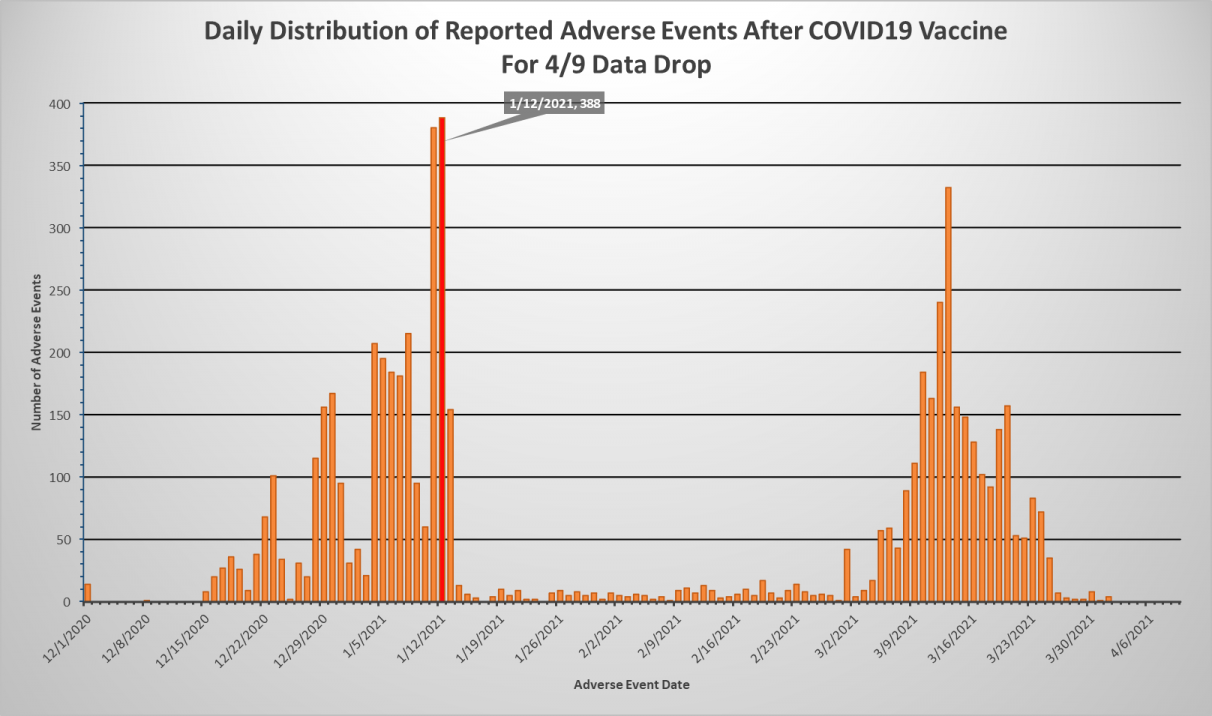
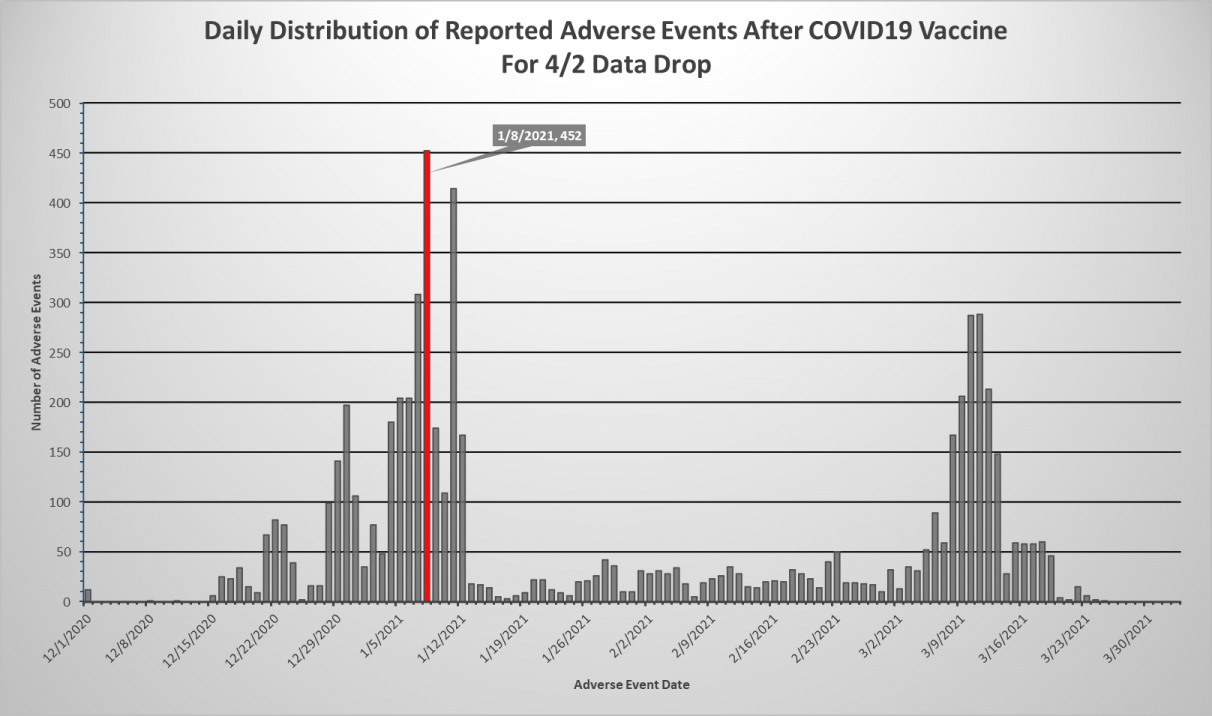
The VAERS data for Covid-19 Vaccines clearly suggest that the data is being throttled and that there is a large backlog of reports that have not been published yet. That topic was addressed in this post. We also estimated the ‘true’ number of adverse events in this post. We will now turn to the task of approximating just how far behind in terms of time the VAERS system actually is. One way to quantify what kind of ‘lag time’ exists is to use the date which corresponds to the highest number of adverse events and then subtract that date from the given data drop date. For example, the chart below shows the number of adverse events by day of occurrence for the data drop on 6/18. The peak of adverse events falls on 4/21. If we subtract 4/21 from 6/18, we get 58 days. So in essence, we can say that the VAERS system is 58 days behind on this particular data drop date based on using the bar with the largest volume of adverse events on the chart as an approximation for where the system is ‘fully caught up to’.

Once every data drop date is put through this same process, we can create a chart like the one below:

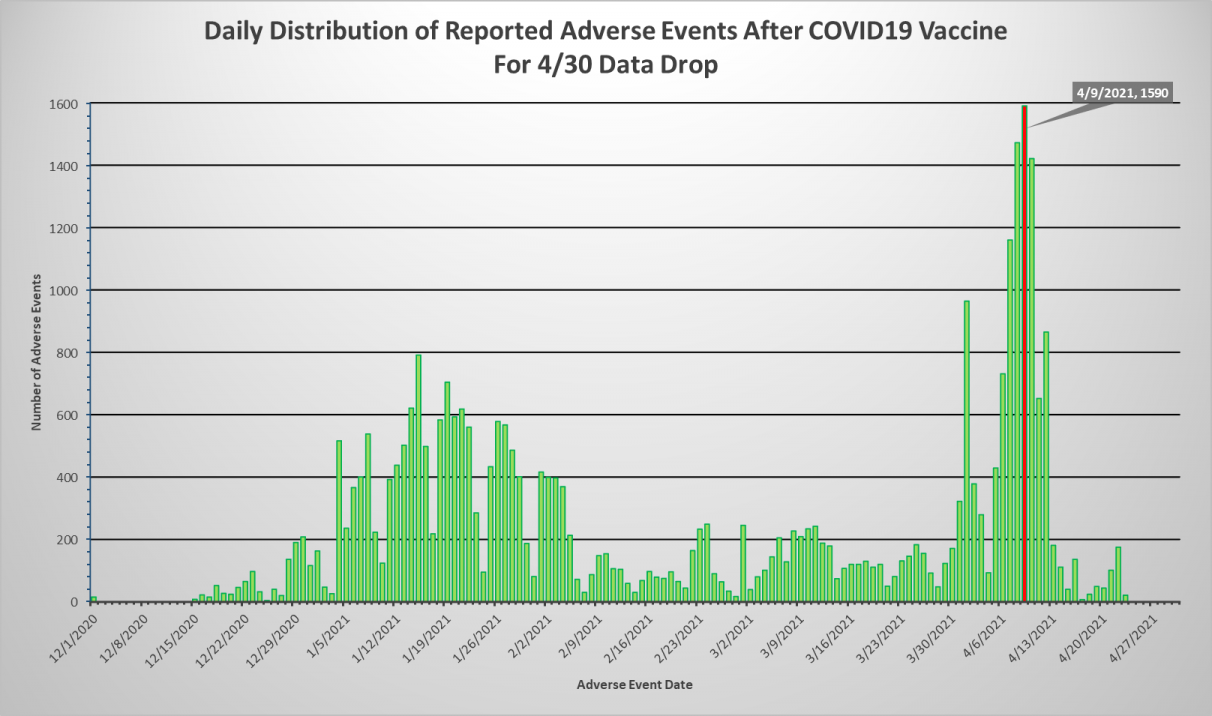
Notice in this chart that with the exception of the one low reading of 21 days of lag time (3 weeks) on the 4/30/21 data drop date, the VAERS system has consistently been well above 50 days of lag (about 7 weeks). The highest lag time recorded was on the 4/16/21 data drop date, where the lag time was 102 days (14.5 weeks). The average is 65 days of lag time (a bit over 9 weeks), and the past 4 weeks has shown a consistent 57-58 day lag (about 8 weeks). For our purposes of approximating the backlog, we will stick with the average, which is 9.3 weeks.
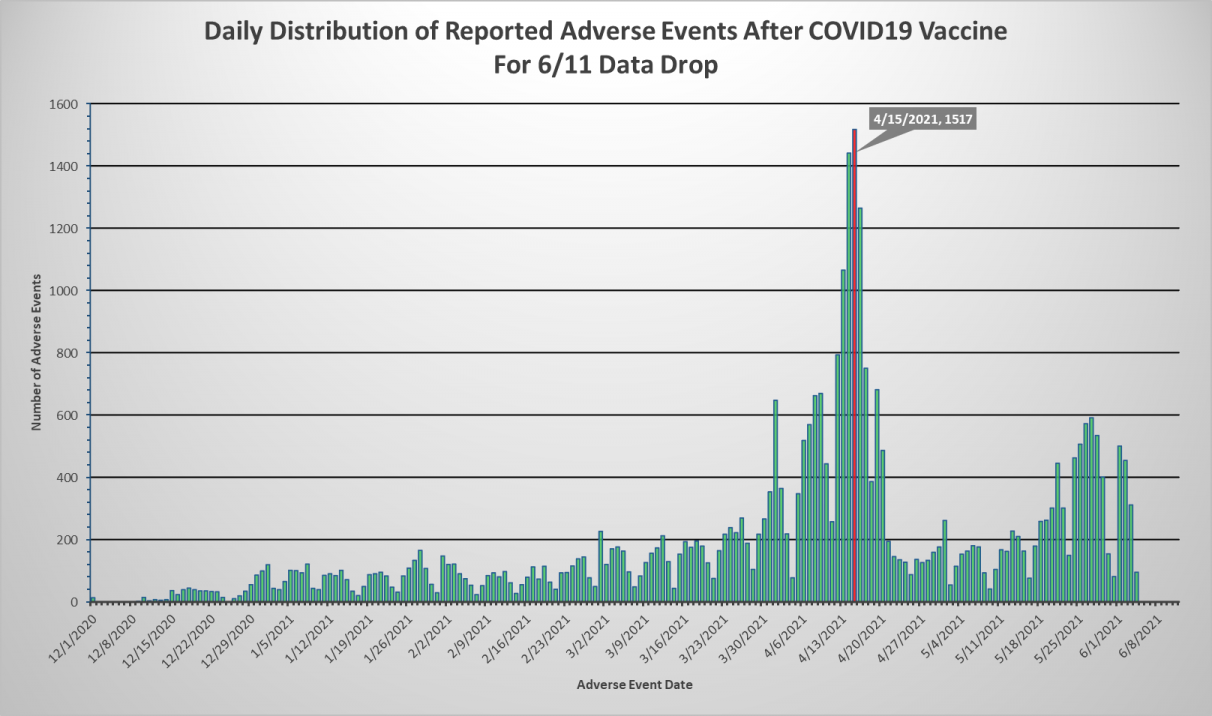
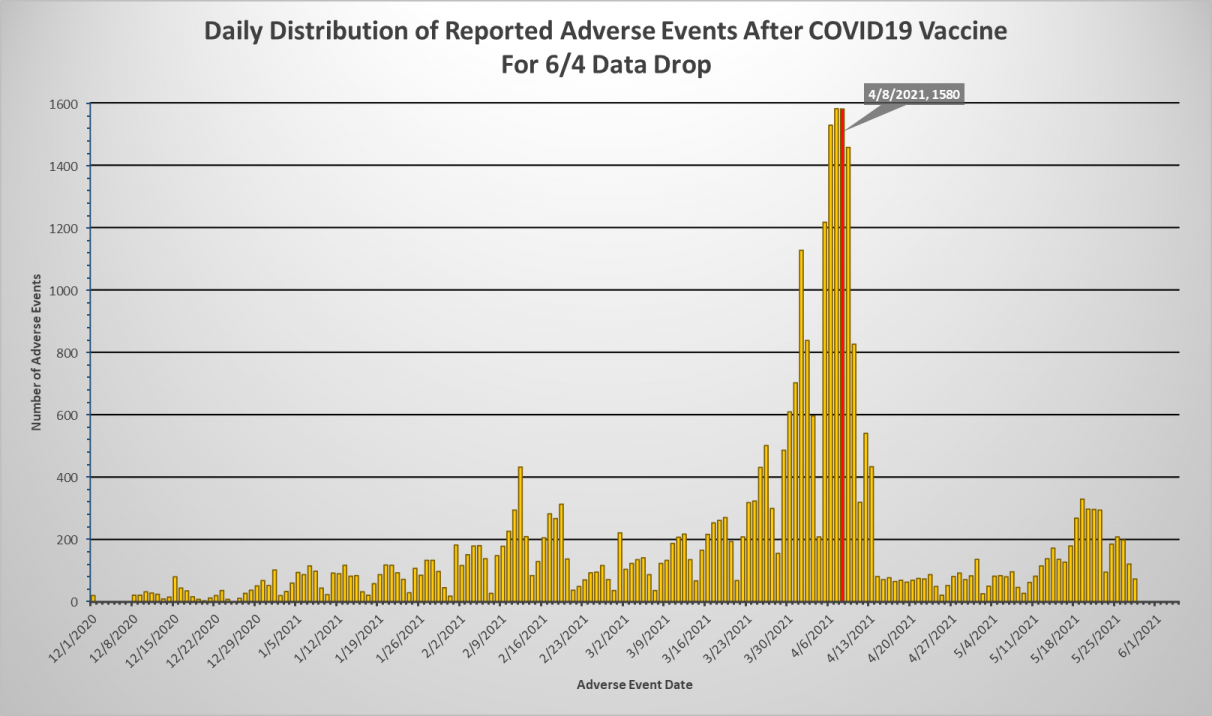
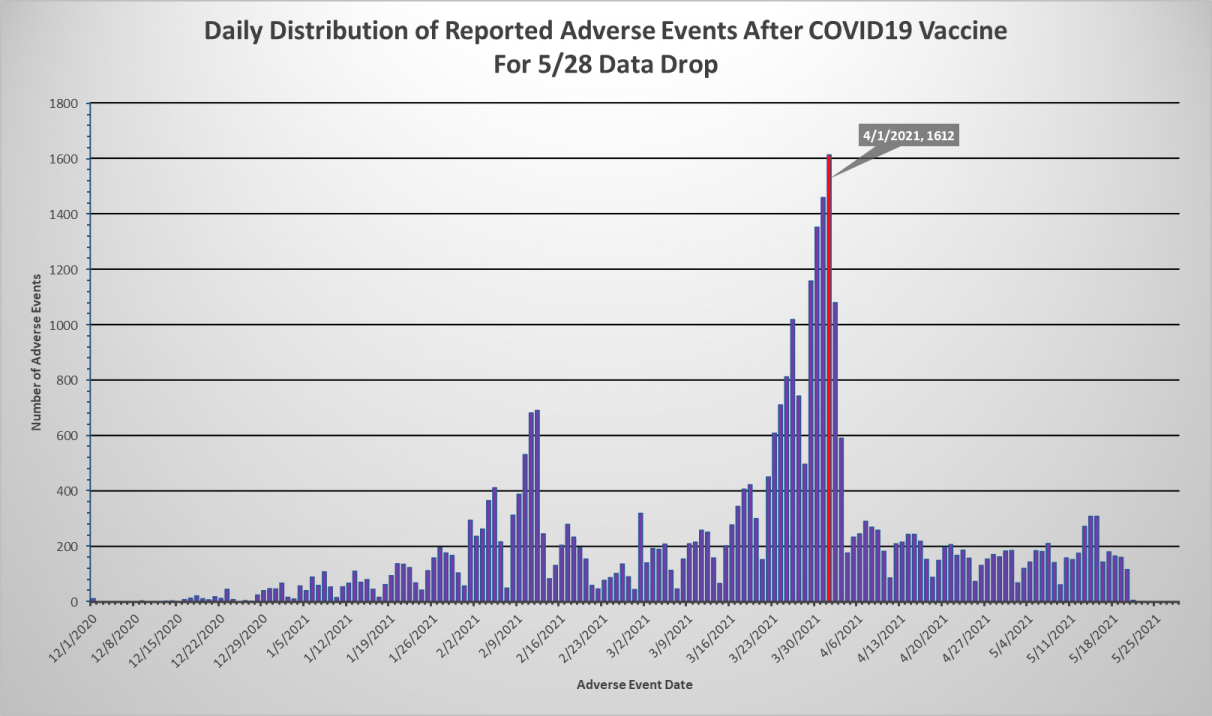
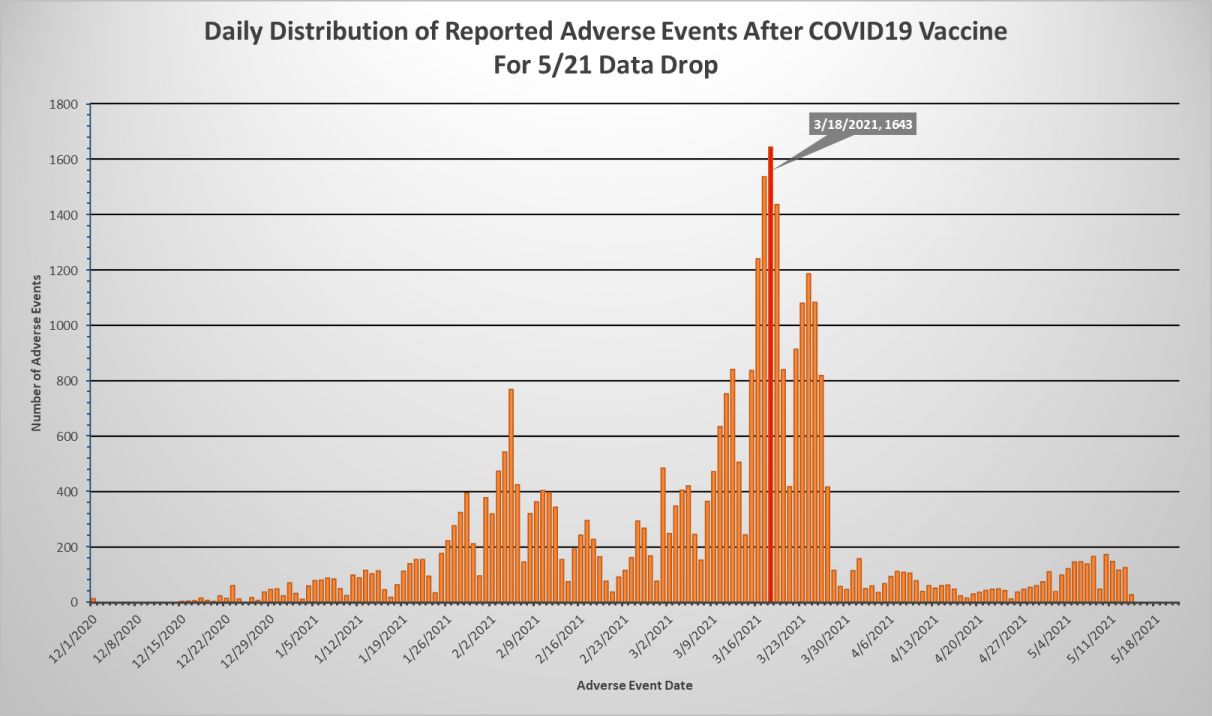
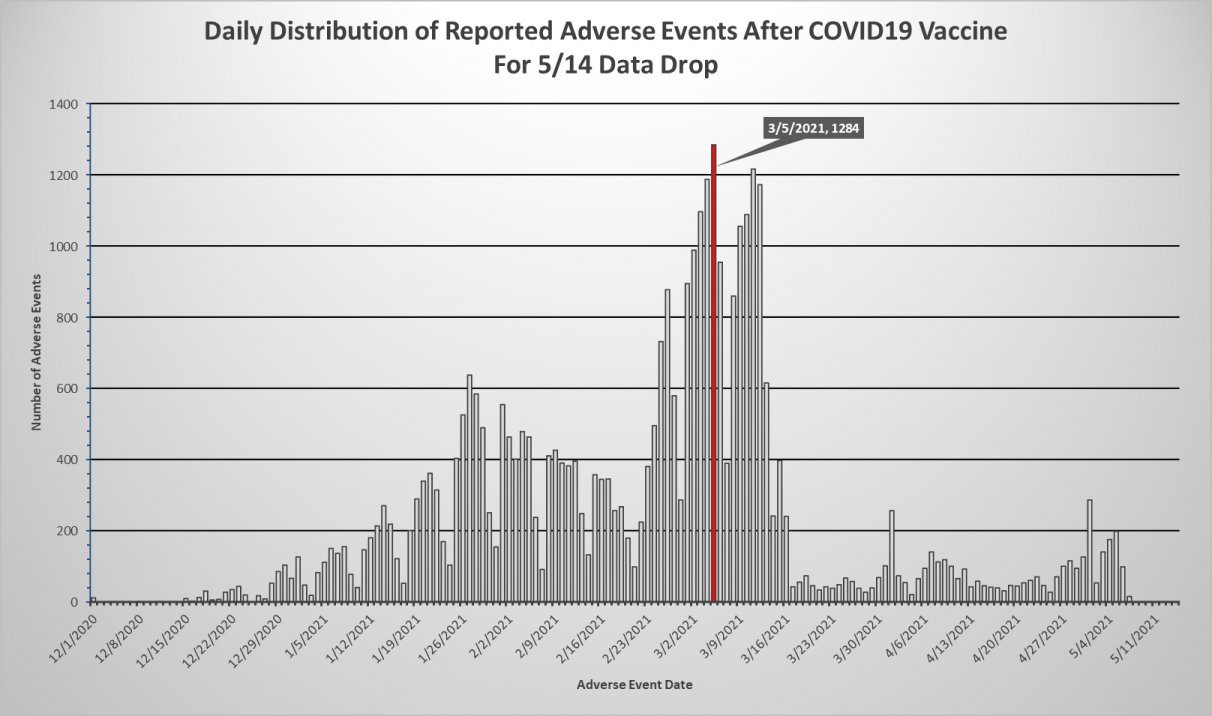
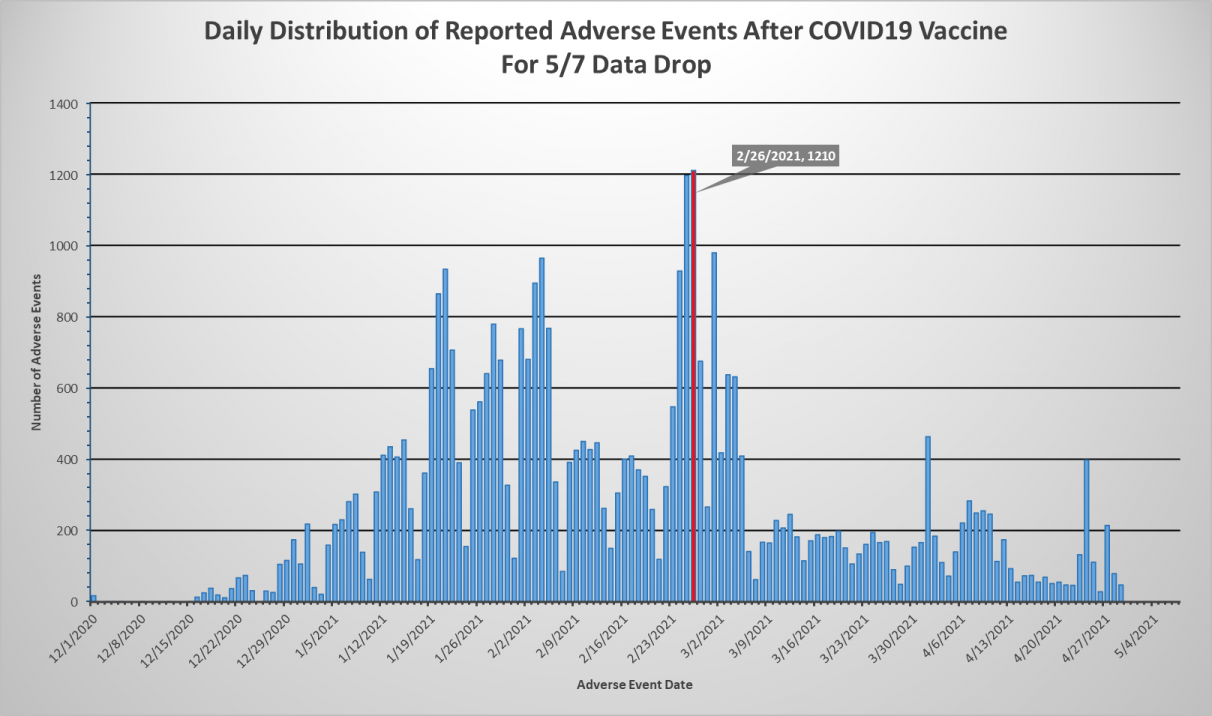
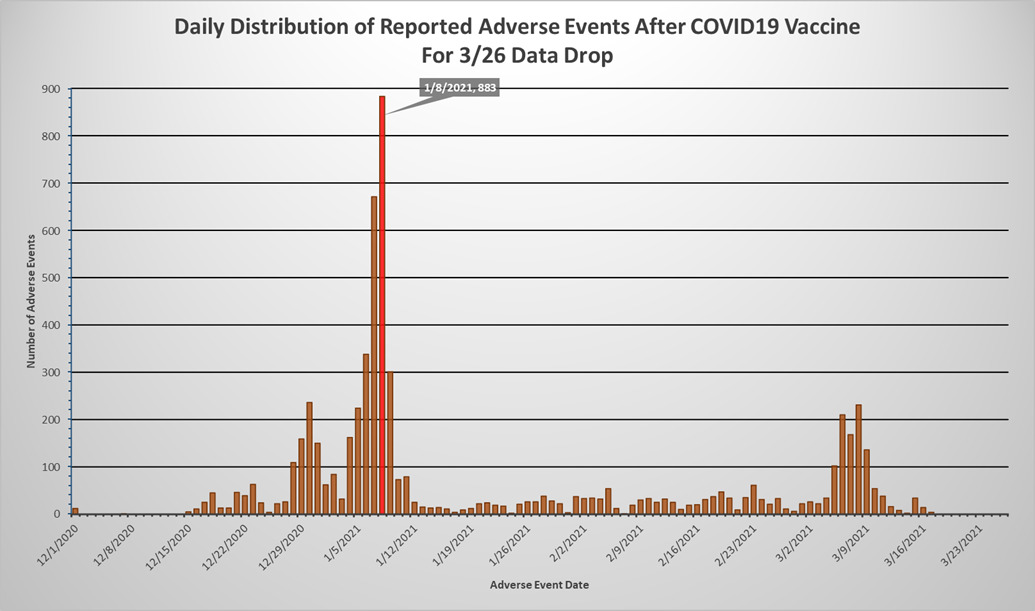
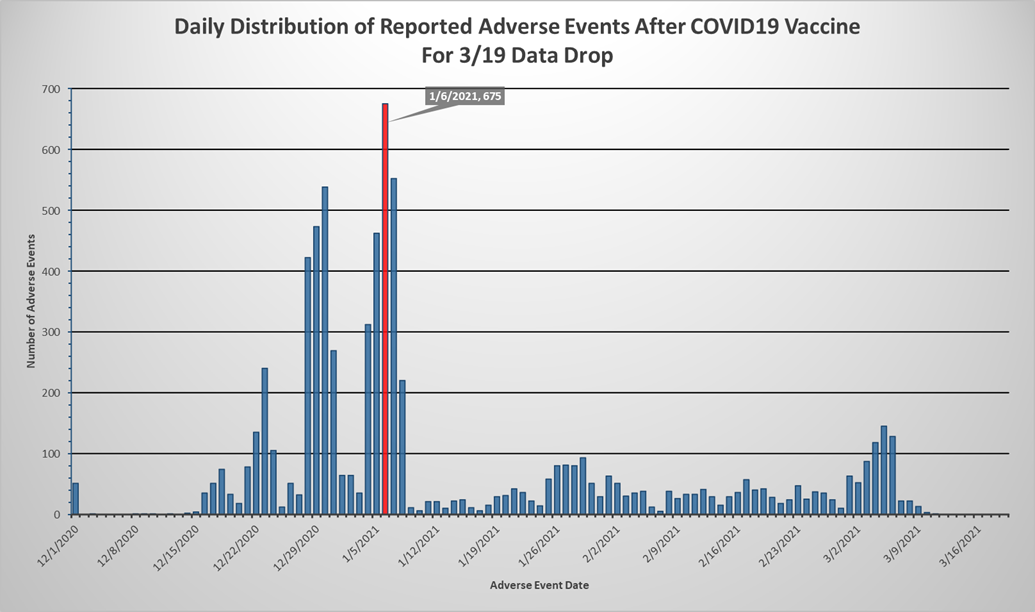
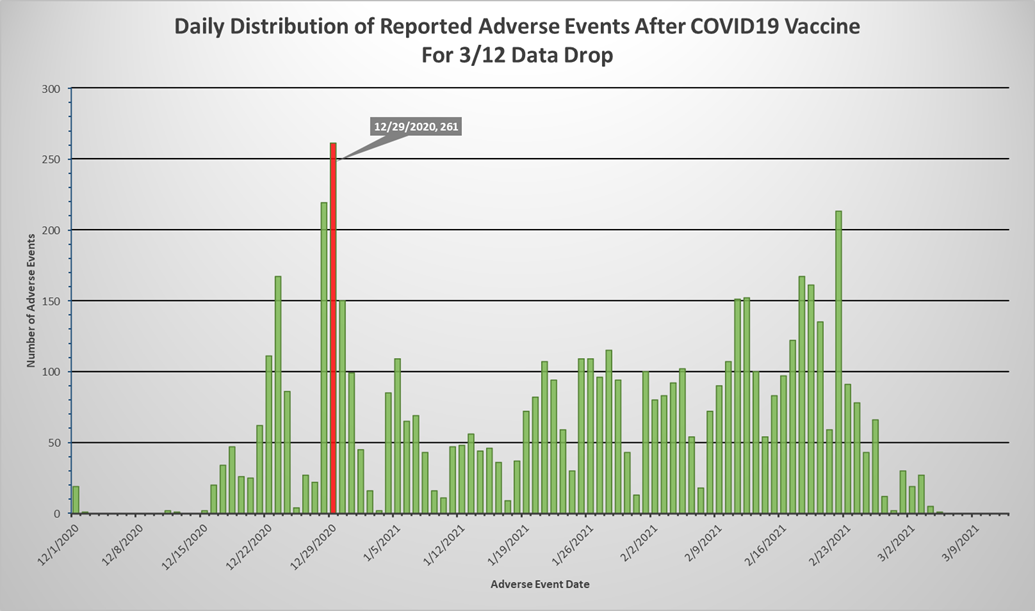
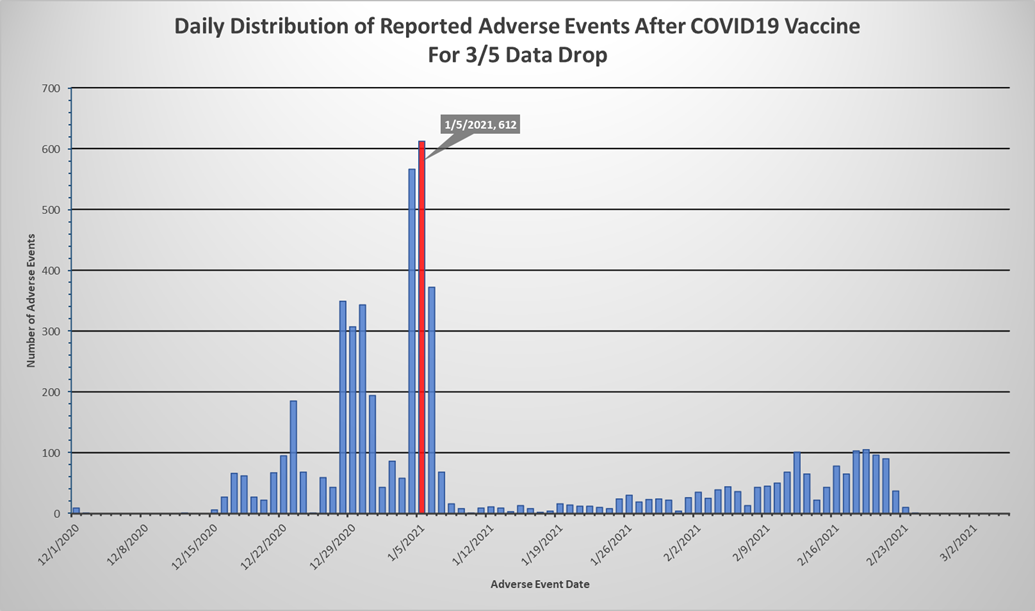
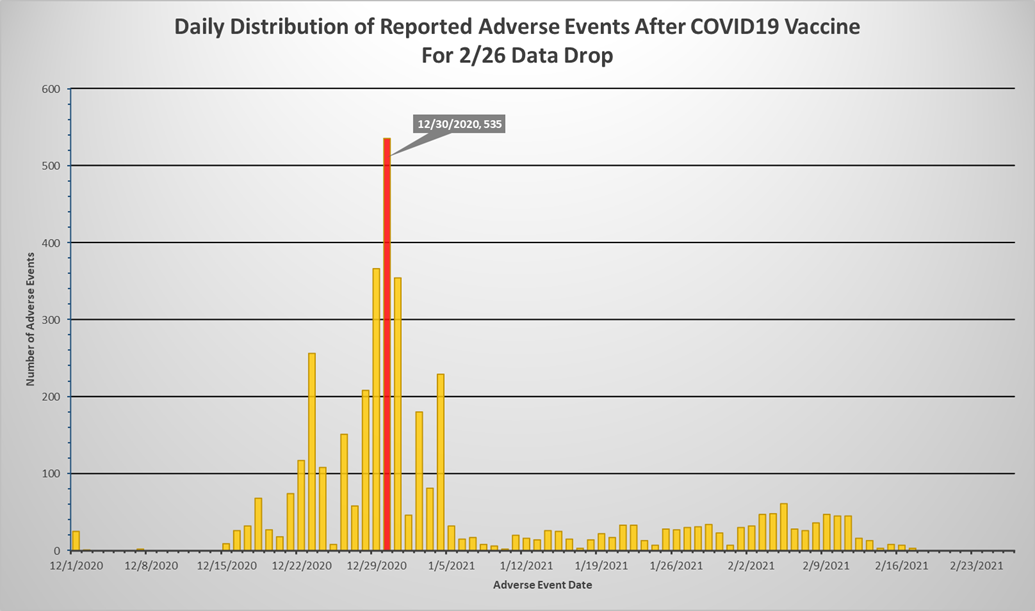
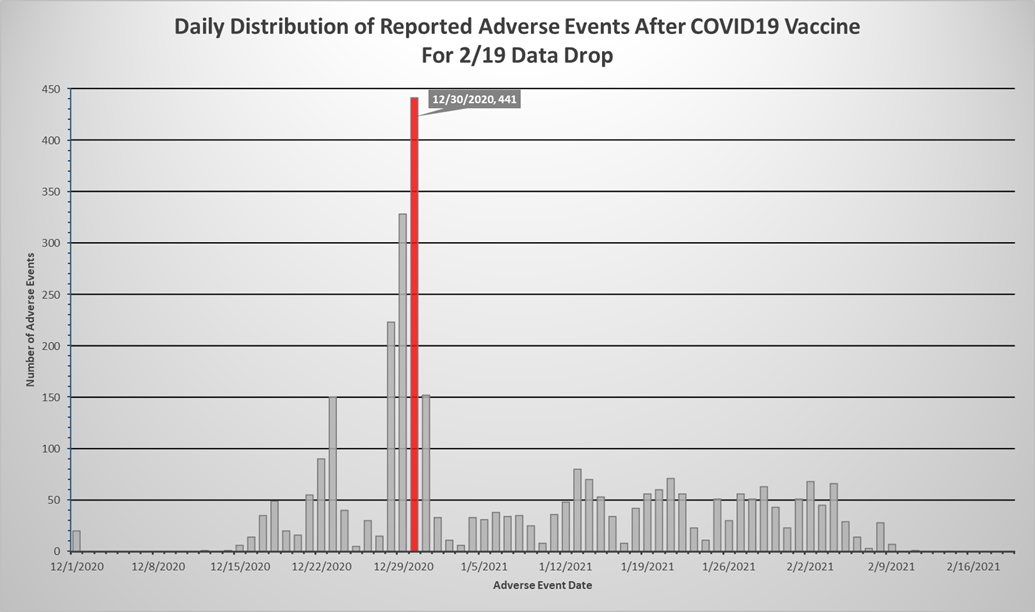
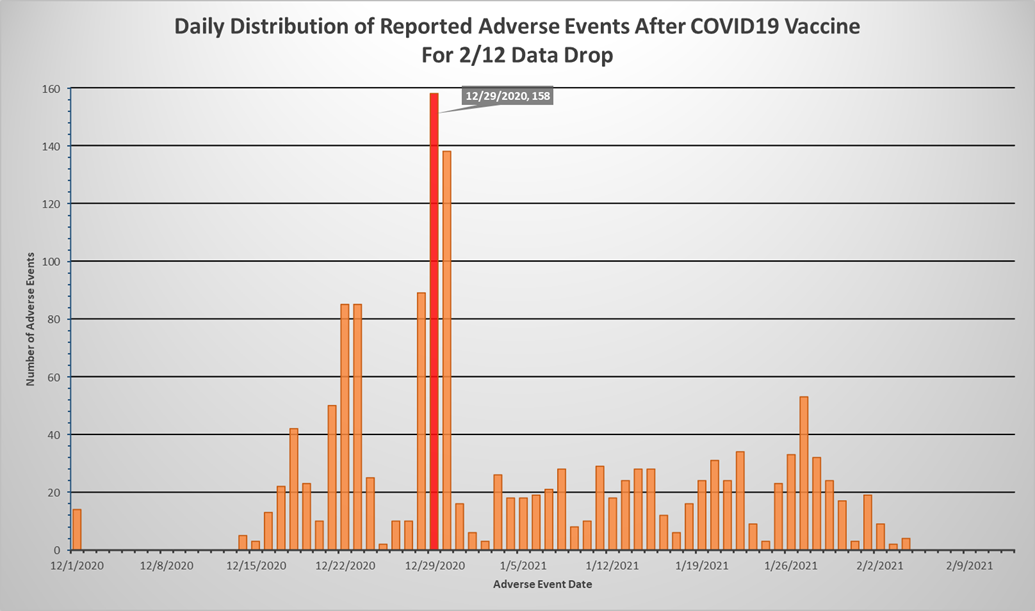
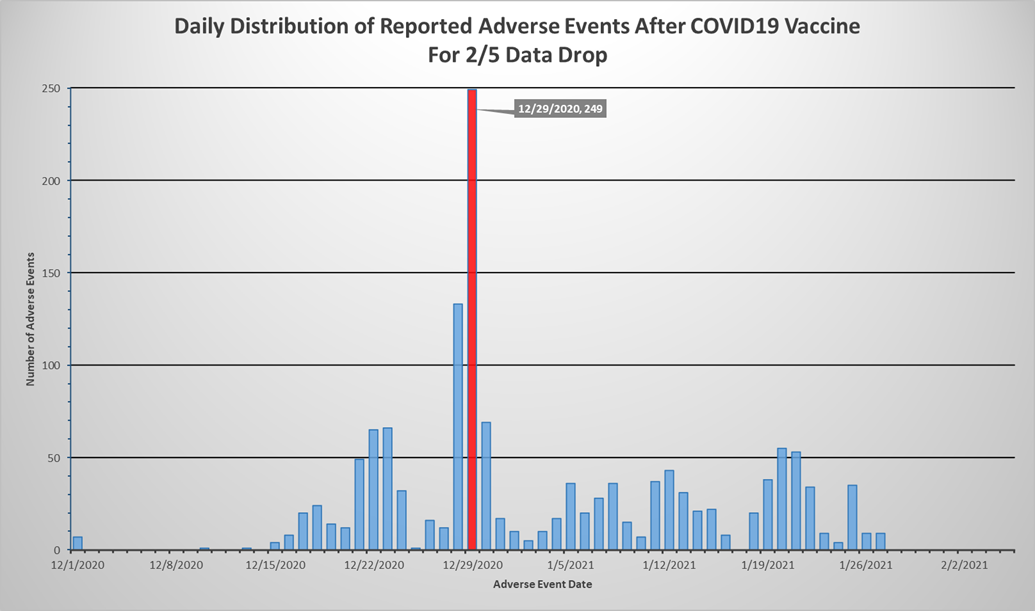
Below is a gallery containing charts showing the distribution of adverse events by date of occurrence for every data drop date (since 2/5/21).
One of the nurses in the following video mentioned that it took almost 3 months between when she reported to VAERS and when they called her to verify:
https://www.bitchute.com/video/lXklzKsCCwmf/