“Therefore to him that knoweth to do good, and doeth it not, to him it is sin.” –James 4:17, King James Bible
While the CDC’s recent release of their 7/29/22 VAERS PRR safety signal analysis (which was forced to come out due to persistent FOIA requests) revealed a massive laundry list of triggered safety signals, in many respects this analysis was incomplete and deficient. If we set aside the CDC’s most glaring failure, which is simply that they did not even perform the regular weekly analysis to begin with (see Part I and Part II), and we instead simply scrutinize what they provided in the 7/29/22 file, it turns out that what they did do was not even done particularly well. They did not follow their own protocols with any level of attentiveness that you might expect from a trusted “Health Authority”. It’s almost as if they slapped something together without putting a whole lot of thought into it (so as to perhaps placate the FOIA requesters who were continually badgering them?). Here is a summary of the deficiencies in the CDC’s PRR analysis of 7/29/22, which reveal, on the whole, a lackluster attempt to address the vitally important issue of VAERS safety surveillance:
- There were numerous valid safety signals missing from their results.
- Their approach to age stratification was severely lacking, resulting in no differentiation between younger adults, older adults and the elderly.
- They performed the PRR analysis in a subpar way by using only the base level MedDRA “Preferred Term” symptoms, rather than aggregating similar, related, and overlapping symptoms into broader, higher-level categories.
- They did not bother to show or perform the PRR analysis for the clearly defined Adverse Events of Special Interest, which are the symptom categories they pre-identified as ones to be on the lookout for.
- The counts of adverse events from the CDC’s 7/29/22 analysis do not match the equivalent figures derived by reproducing their analysis using the publicly available VAERS Dataset that was released on 7/29/22.
Addressing each of the points above in order:
Missing Safety Signals: Numerous valid safety signals, based on the CDC’s methodology for PRR analysis, were missing from the CDC’s 7/29/22 results, 941 in all. However, many of these missing safety signals were for diagnostic procedures (eg. ‘Blood test’ or ‘Biopsy’ or ‘Chest X-ray’), and many of these have a neutral tone, and do not necessarily indicate anything negative. If we attempt to filter out most of these diagnostic and “neutral” symptoms, and focus solely on potentially serious safety signals, we will come up with a list such as the one below. (The full results file is linked below the table as well for your perusal.)
Safety Signals Missing from CDC's 7/29/22 PRR Analysis (selected records)
| Age Group | Symptom | Covid Vax AEs | Total Covid Vax AEs | Non-Covid Vax AEs | Non-Covid Vax Total AEs | PRR | Chi-Square |
|---|---|---|---|---|---|---|---|
| 05-11 | Hyponatraemia | 5 | 12207 | 1 | 31065 | 12.72 | 9.00 |
| 05-11 | Cardiac murmur | 5 | 12207 | 1 | 31065 | 12.72 | 9.00 |
| 05-11 | Acute respiratory failure | 4 | 12207 | 1 | 31065 | 10.18 | 6.62 |
| 05-11 | Multi-organ disorder | 4 | 12207 | 1 | 31065 | 10.18 | 6.62 |
| 05-11 | Coagulopathy | 3 | 12207 | 1 | 31065 | 7.63 | 4.32 |
| 05-11 | Cardio-respiratory arrest | 3 | 12207 | 1 | 31065 | 7.63 | 4.32 |
| 05-11 | Sinus arrhythmia | 3 | 12207 | 1 | 31065 | 7.63 | 4.32 |
| 05-11 | Haematuria | 12 | 12207 | 8 | 31065 | 3.82 | 9.98 |
| 05-11 | Synovitis | 13 | 12207 | 15 | 31065 | 2.21 | 4.59 |
| 05-11 | Chest discomfort | 56 | 12207 | 69 | 31065 | 2.07 | 17.04 |
| 12-17 | Pneumothorax | 7 | 31494 | 1 | 32928 | 7.32 | 4.77 |
| 12-17 | Cardiac arrest | 16 | 31494 | 4 | 32928 | 4.18 | 7.75 |
| 12-17 | Myocardial infarction | 10 | 31494 | 3 | 32928 | 3.49 | 4.09 |
| 12-17 | Polymenorrhoea | 16 | 31494 | 6 | 32928 | 2.79 | 5.01 |
| 18+ | Cardiac dysfunction | 51 | 659945 | 1 | 257220 | 19.88 | 17.58 |
| 18+ | Cerebral venous sinus thrombosis | 135 | 659945 | 3 | 257220 | 17.54 | 45.78 |
| 18+ | Pelvic venous thrombosis | 34 | 659945 | 1 | 257220 | 13.25 | 11.00 |
| 18+ | Superficial vein thrombosis | 97 | 659945 | 3 | 257220 | 12.6 | 31.09 |
| 18+ | Metastatic neoplasm | 31 | 659945 | 1 | 257220 | 12.08 | 9.85 |
| 18+ | Cardiac ventricular thrombosis | 30 | 659945 | 1 | 257220 | 11.69 | 9.46 |
| 18+ | Cerebral atrophy | 99 | 659945 | 4 | 257220 | 9.65 | 29.80 |
| 18+ | Cerebral small vessel ischaemic disease | 123 | 659945 | 5 | 257220 | 9.59 | 36.96 |
| 18+ | Myocardial injury | 41 | 659945 | 2 | 257220 | 7.99 | 11.66 |
| 18+ | Posterior reversible encephalopathy syndrome | 19 | 659945 | 1 | 257220 | 7.41 | 5.26 |
| 18+ | Venous thrombosis | 36 | 659945 | 2 | 257220 | 7.02 | 9.77 |
| 18+ | Invasive ductal breast carcinoma | 18 | 659945 | 1 | 257220 | 7.02 | 4.89 |
| 18+ | Insulin-requiring type 2 diabetes mellitus | 18 | 659945 | 1 | 257220 | 7.02 | 4.89 |
| 18+ | Embolism arterial | 18 | 659945 | 1 | 257220 | 7.02 | 4.89 |
| 18+ | Post procedural haemorrhage | 17 | 659945 | 1 | 257220 | 6.63 | 4.51 |
| 18+ | Peripheral embolism | 17 | 659945 | 1 | 257220 | 6.63 | 4.51 |
| 18+ | Exposure via breast milk | 63 | 659945 | 4 | 257220 | 6.14 | 16.18 |
| 18+ | Uterine haemorrhage | 83 | 659945 | 6 | 257220 | 5.39 | 20.02 |
| 18+ | Heart injury | 26 | 659945 | 2 | 257220 | 5.07 | 6.06 |
| 18+ | Tachyarrhythmia | 26 | 659945 | 2 | 257220 | 5.07 | 6.06 |
| 18+ | Carotid artery stenosis | 60 | 659945 | 5 | 257220 | 4.68 | 13.34 |
| 18+ | Basal ganglia stroke | 23 | 659945 | 2 | 257220 | 4.48 | 4.98 |
| 18+ | Hepatic encephalopathy | 34 | 659945 | 3 | 257220 | 4.42 | 7.29 |
| 18+ | Goitre | 163 | 659945 | 15 | 257220 | 4.24 | 33.95 |
| 18+ | Atrial tachycardia | 43 | 659945 | 4 | 257220 | 4.19 | 8.89 |
| 18+ | Cerebral ischaemia | 51 | 659945 | 5 | 257220 | 3.98 | 10.14 |
| 18+ | Sinus tachycardia | 569 | 659945 | 56 | 257220 | 3.96 | 112.89 |
| 18+ | Cerebellar infarction | 39 | 659945 | 4 | 257220 | 3.8 | 7.49 |
| 18+ | Hepatic cyst | 46 | 659945 | 5 | 257220 | 3.59 | 8.41 |
| 18+ | Thrombophlebitis | 45 | 659945 | 5 | 257220 | 3.51 | 8.07 |
| 18+ | Apraxia | 35 | 659945 | 4 | 257220 | 3.41 | 6.12 |
| 18+ | Facial spasm | 86 | 659945 | 10 | 257220 | 3.35 | 14.79 |
| 18+ | Status epilepticus | 42 | 659945 | 5 | 257220 | 3.27 | 7.06 |
| 18+ | Brain stem stroke | 25 | 659945 | 3 | 257220 | 3.25 | 4.17 |
| 18+ | Encephalopathy | 411 | 659945 | 53 | 257220 | 3.02 | 63.57 |
| 18+ | Renal cyst | 92 | 659945 | 12 | 257220 | 2.99 | 14.04 |
| 18+ | Sepsis | 1270 | 659945 | 169 | 257220 | 2.93 | 189.78 |
| 18+ | Atrioventricular block second degree | 52 | 659945 | 7 | 257220 | 2.9 | 7.66 |
| 18+ | Haematuria | 406 | 659945 | 55 | 257220 | 2.88 | 59.35 |
| 18+ | Conjunctival haemorrhage | 117 | 659945 | 16 | 257220 | 2.85 | 16.91 |
| 18+ | Chronic obstructive pulmonary disease | 680 | 659945 | 94 | 257220 | 2.82 | 97.05 |
| 18+ | Renal failure | 442 | 659945 | 62 | 257220 | 2.78 | 61.94 |
| 18+ | Haematemesis | 219 | 659945 | 31 | 257220 | 2.75 | 30.33 |
| 18+ | Tachycardia | 5783 | 659945 | 831 | 257220 | 2.71 | 791.19 |
| 18+ | Cardiac murmur | 132 | 659945 | 19 | 257220 | 2.71 | 17.89 |
| 18+ | Autoimmune haemolytic anaemia | 48 | 659945 | 7 | 257220 | 2.67 | 6.40 |
| 18+ | Pneumothorax | 202 | 659945 | 30 | 257220 | 2.62 | 26.27 |
| 18+ | Sinus arrhythmia | 87 | 659945 | 13 | 257220 | 2.61 | 11.22 |
| 18+ | Rectal haemorrhage | 280 | 659945 | 42 | 257220 | 2.6 | 35.92 |
| 18+ | Craniocerebral injury | 37 | 659945 | 6 | 257220 | 2.4 | 4.23 |
| 18+ | Aneurysm | 49 | 659945 | 8 | 257220 | 2.39 | 5.54 |
| 18+ | Disseminated intravascular coagulation | 49 | 659945 | 8 | 257220 | 2.39 | 5.54 |
| 18+ | Facial asymmetry | 67 | 659945 | 11 | 257220 | 2.37 | 7.51 |
| 18+ | Aphasia | 1620 | 659945 | 270 | 257220 | 2.34 | 177.68 |
| 18+ | Haemolysis | 42 | 659945 | 7 | 257220 | 2.34 | 4.60 |
| 18+ | White matter lesion | 118 | 659945 | 20 | 257220 | 2.3 | 12.56 |
| 18+ | Nephrolithiasis | 343 | 659945 | 60 | 257220 | 2.23 | 34.58 |
| 18+ | Pancytopenia | 131 | 659945 | 23 | 257220 | 2.22 | 13.12 |
| 18+ | Vulvovaginal pain | 114 | 659945 | 20 | 257220 | 2.22 | 11.43 |
| 18+ | Cardiomyopathy | 215 | 659945 | 38 | 257220 | 2.21 | 21.28 |
| 18+ | Ovarian cyst | 136 | 659945 | 24 | 257220 | 2.21 | 13.50 |
| 18+ | Thrombocytopenia | 633 | 659945 | 112 | 257220 | 2.2 | 62.55 |
| 18+ | Gout | 432 | 659945 | 78 | 257220 | 2.16 | 41.11 |
| 18+ | Head titubation | 72 | 659945 | 13 | 257220 | 2.16 | 6.85 |
| 18+ | Vertigo | 7460 | 659945 | 1362 | 257220 | 2.13 | 701.51 |
| 18+ | Haematochezia | 521 | 659945 | 96 | 257220 | 2.12 | 47.70 |
| 18+ | Neutropenia | 96 | 659945 | 18 | 257220 | 2.08 | 8.49 |
| 18+ | Osteomyelitis | 64 | 659945 | 12 | 257220 | 2.08 | 5.66 |
| 18+ | Generalised tonic-clonic seizure | 346 | 659945 | 65 | 257220 | 2.07 | 30.48 |
| 18+ | Vaginal discharge | 136 | 659945 | 26 | 257220 | 2.04 | 11.55 |
| 18+ | Seizure | 3556 | 659945 | 689 | 257220 | 2.01 | 294.98 |
How could they miss these signals? Considering how vital this data was in providing early warning signs of any potential safety concerns regarding these experimental injections (in hindsight we know that these concerns were more than warranted), this is potentially sloppy work on the part of the CDC [edit: read last bolded point below for a possible alternate explanation for these missing signals].
Poor Age Stratification: Despite the suggestions of their own SOP document (pg. 14-15) which indicate that they would be creating reporting tables for AESIs that would have no less than 4 separate groups for ages 18 and up (eg. 18-49, 50-64, 75-84, 85+), they went ahead and opted for one large group for 18 year-olds and up. This essentially lumps older teenagers, young adults, adults in the prime of their life, over the hill adults, retirement folks, and the elderly, all into one huge category. These different aged groups often have very different health profiles, and this one-size-fits-all approach only serves to obfuscate the results, as no distinction can be made between groups of people who are certainly very different.
PRR Analysis Performed Only Against the Base Level Symptoms: Each record in VAERS is associated with one or more base level MedDRA “Preferred Term” symptoms. Often these symptoms overlap and are related to the same basic pathology or condition. Broader categories exist (eg. MedDRA “High-Level Terms” or even “High-Level Group Terms”), or can be pre-defined (such as the CDC’s AESIs), which encompass multiple base level symptoms. The CDC chose to perform the PRR analysis on the lower level MedDRA PT symptoms, without aggregating similar and related symptoms into broader categories. By not combining overlapping lower level symptoms into higher-level classifications, signals can potentially be hidden due to the “dilution” of the AE counts across several individual symptoms which may overlap or are related in pathology. In fact, many lower level symptoms are practically identical. Did they do it this way on purpose, to attempt to suppress some signals, to no avail?
No PRR Analysis at All on AESIs: The CDC pre-identified certain Adverse Events of Special Interest (SOP document starting on pg. 30), as these were the categories of symptoms to be on “high alert” for. And yet, when they performed the analysis, why did they not bother to calculate the PRRs for these special interest categories? This is the most basic thing they charged themselves with doing. Did they want to hide these signals, again to no avail, by trying to bury them in the noise of the hundreds of individual symptoms?
Numbers in CDC Analysis Don’t Match the Public VAERS Dataset: One last thing to take note of is that the counts of adverse events from the CDC’s analysis do not match up with the numbers from the public VAERS dataset which was released back on 7/29/22. It is not a question of whether we are using the correct publicly released dataset from VAERS, as no other previously released dataset within plus or minus 1 month of the 7/29/22 dataset has numbers that match up better to the numbers from the CDC’s analysis. While many of the numbers are fairly similar, many are also off by quite a lot, and off by enough to result in noticeable differences in some of the calculated PRRs. Upon closer examination of these differences, it now seems very likely that the CDC is using some form of “internal” dataset that is different (but similar) to the one distributed for public consumption. In any event, it appears that the PRRs are predominantly higher when using the public dataset vs. using the CDC’s numbers. Given this, it is certainly possible that some of the signals missing from the CDC analysis are “lost” due to enough of a difference between the adverse event counts between the two datasets to drive the CDC’s PRR number below the required threshold of 2. As such, without actually seeing the original data that they used, it is not really possible to make a firm conclusion about what is going on here.
However, what is certain is that the CDC is using a dataset that doesn’t have precisely the same numbers. The public is owed an explanation by the CDC here. If they are truly interested in openness and transparency, then they should document and explain to the public exactly why there are these differences. Failing to do so constitutes withholding information that rightfully should be disclosed and simply perpetuates the CDC’s tarnished image of dealing in obfuscation and deceit.
For comparison purposes, here are the actual overall adverse event counts from both the CDC’s dataset and the public VAERS dataset from 7/29/22:
| Age Group | # of Covid19 mRNA AEs from Public VAERS download of 7/29/22 | # of Covid19 mRNA AEs from CDC's 7/29/22 PRR Analysis | Difference (%) | # of Non-Covid-19 AEs from Public VAERS download of 7/29/22 | # of Non-Covid19 AEs from CDC's 7/29/22 PRR Analysis | Difference (%) | |
|---|---|---|---|---|---|---|---|
| 5-11 Yrs | 12207 | 12329 | -1.0 | 31066 | 29071 | +6.4 | |
| 12-17 Yrs | 31494 | 31447 | +0.15 | 32928 | 30084 | +8.6 |
|
| 18+ | 659945 | 660643 | -0.11 | 257221 | 242091 | +5.9 | |
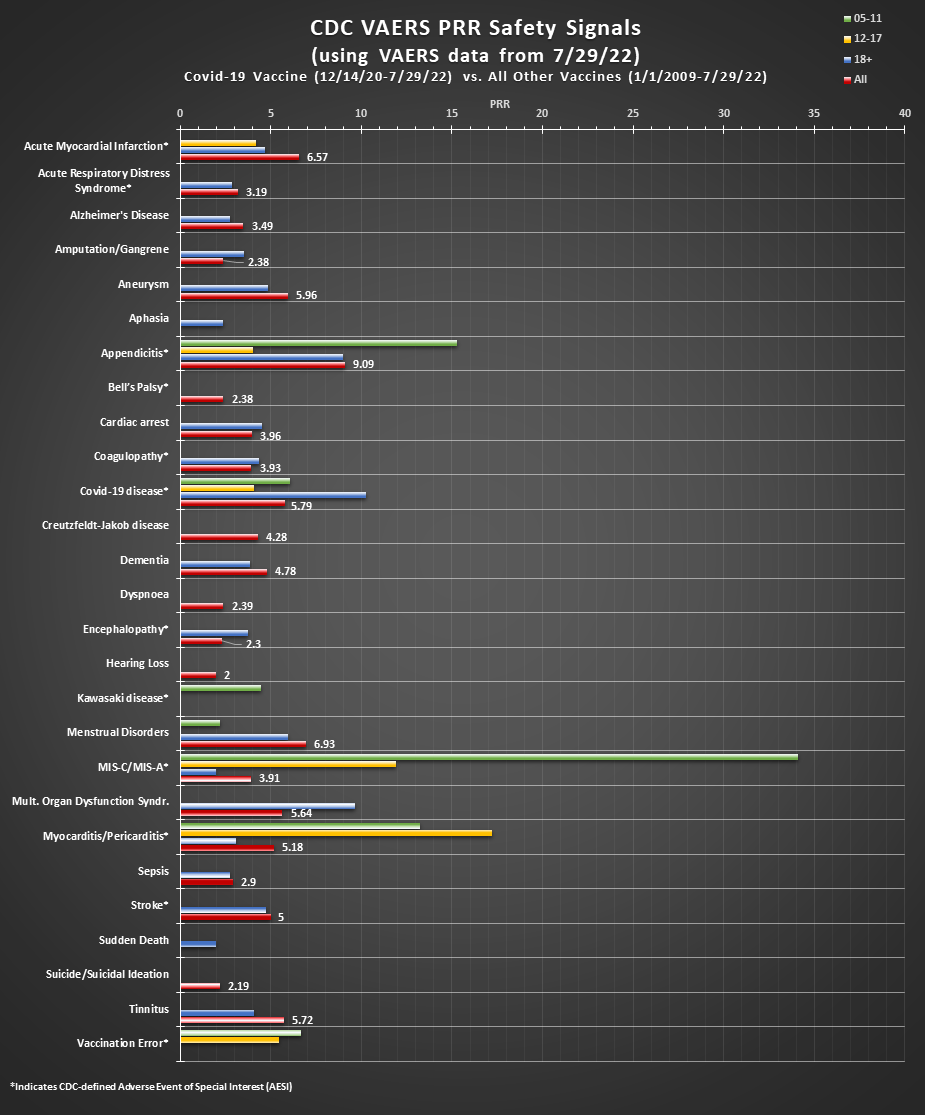
Beyond the fact that the PRR analysis the CDC provided is incomplete, a list of the 770 or so symptoms (in the 18+ age group in the CDC’s analysis) is not easy for the average casual observer to look and wade through, as it is easy to get lost in the weeds and miss the forest from the trees. What the CDC should have provided at a bare minimum, is something which graphically summarizes the PRRs for the pre-identified AESIs and also for other groups of symptoms that are of high interest or concern. What they should have provided, is something like this:
In conclusion, perhaps any one of these above points taken in isolation could be shrugged off as a “nothing to see here, move along” type of thing. However, when taken in aggregate, they paint a concerning picture of incompetence and carelessness. It becomes worse yet when you add in the fact that they didn’t do the analysis (or suppressed it) until well over a year after initial jab rollout (as explained in Part I and Part II); it reveals a stunning portrayal of willful negligence and all-out disregard for the public at large. The CDC has utterly missed the mark on safety surveillance with the Covid-19 vaccines. Pleading ignorance, or worse yet, continuing to acknowledge no guilt or wrongdoing and speeding down a path that leads to ruin and destruction while clear and present danger signals continue blaring is completely indefensible at this point. We are way beyond the point of feigned ignorance and are well into the territory of intentional evil, even if simply through acts of omission. A “guilty as charged” verdict is fully earned when one knows the right thing to do, and yet does not do it, especially when human lives are at stake. The CDC has failed catastrophically in protecting the safety and health of the public as attested to by the ever-growing number of innocents wounded, disabled or killed by these experimental shots.
Since we can no longer trust the CDC to act in the interest of public health, nor to follow their own protocols in doing a proper, thorough, timely, and accurate PRR analysis, we may need to look to other sources for this type of important information. At this point, some random dude’s work on the internet could hardly be worse…
Weekly PRR safety signal reports are now available here.
After outing itself as an organization that doesn’t value transparency, doesn’t follow its own established protocols, doesn’t provide the safety analyses requested via FOIA in a timely manner, and doesn’t even do the analyses properly when forced to do so, the CDC has abandoned any rational justification for its continued existence. It is way past time to shut down the CDC for good…It is time for an alternate plan for public health…perhaps “Plan B”?