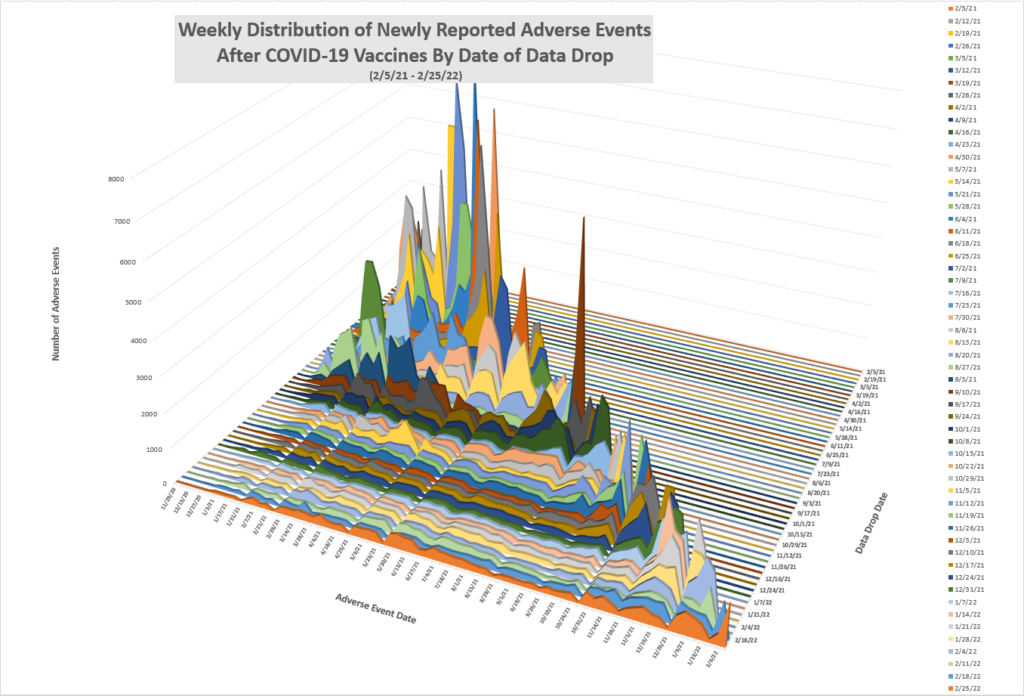
Update 2/25/22: New chart posted.
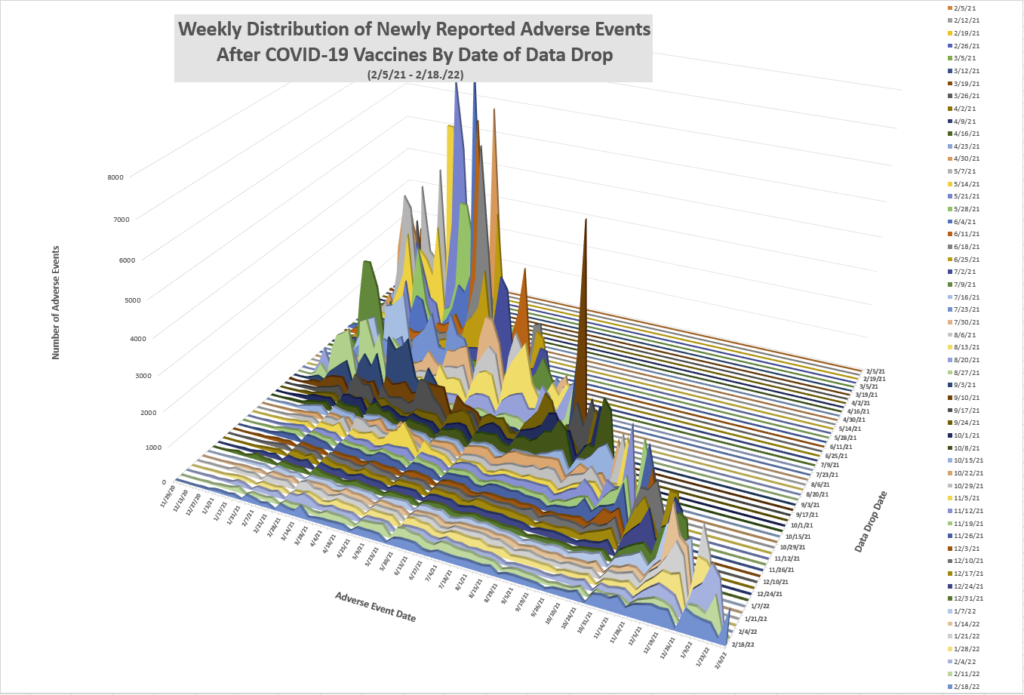
Update 2/18/22: New chart posted.
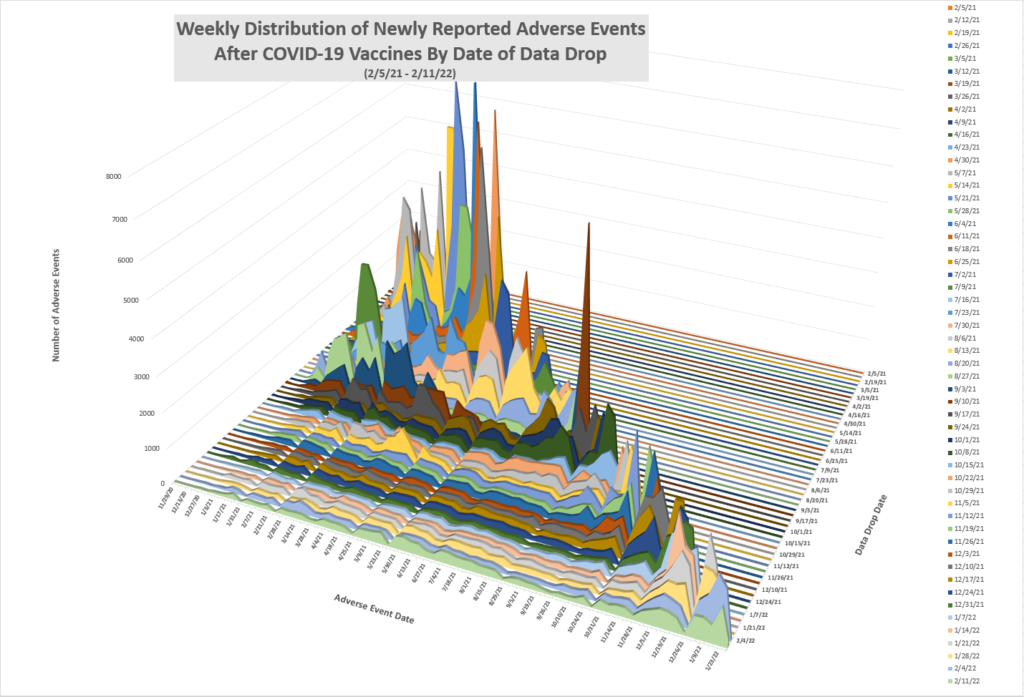
Update 2/11/22: New chart posted.
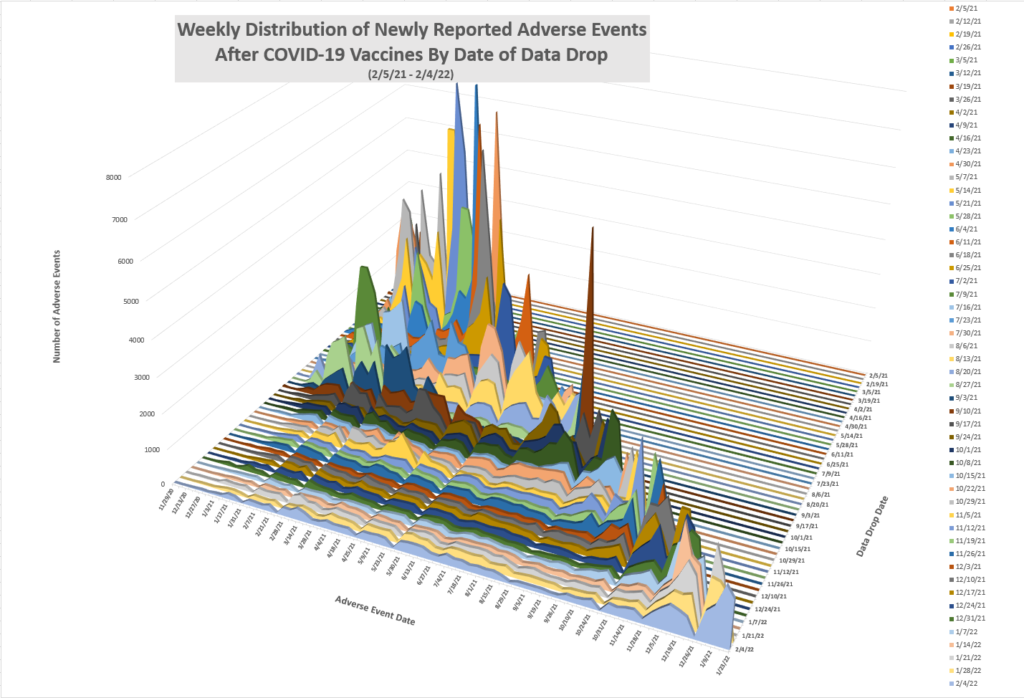
Update 2/4/22: New chart posted.
Update 1/28/22: New chart posted.

Update 1/21/22: New chart posted.

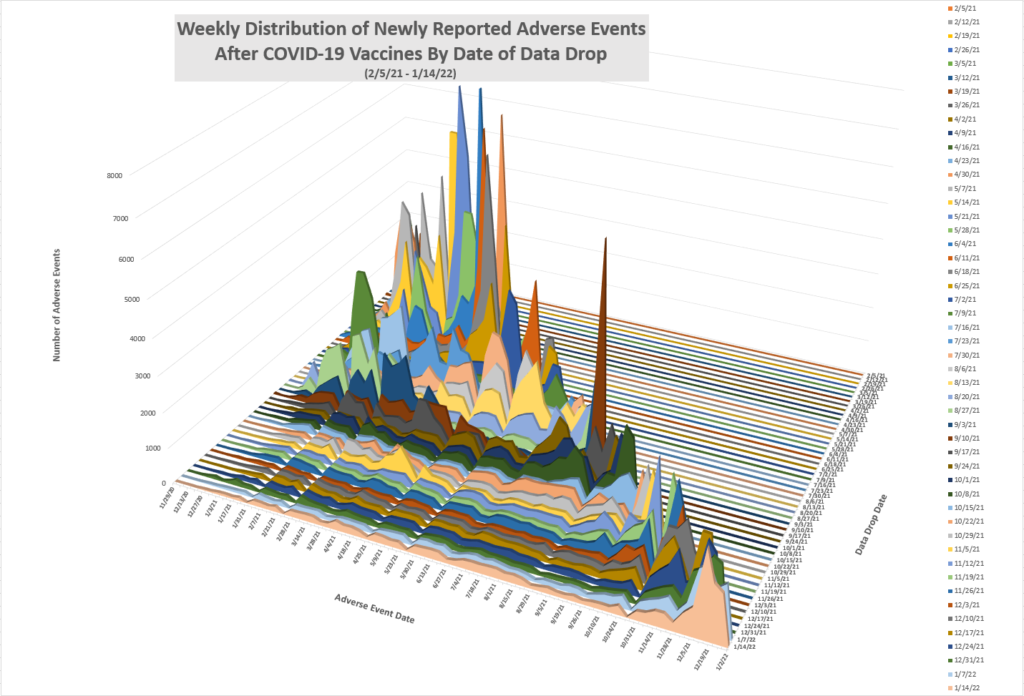
Update 1/14/22: New chart posted.
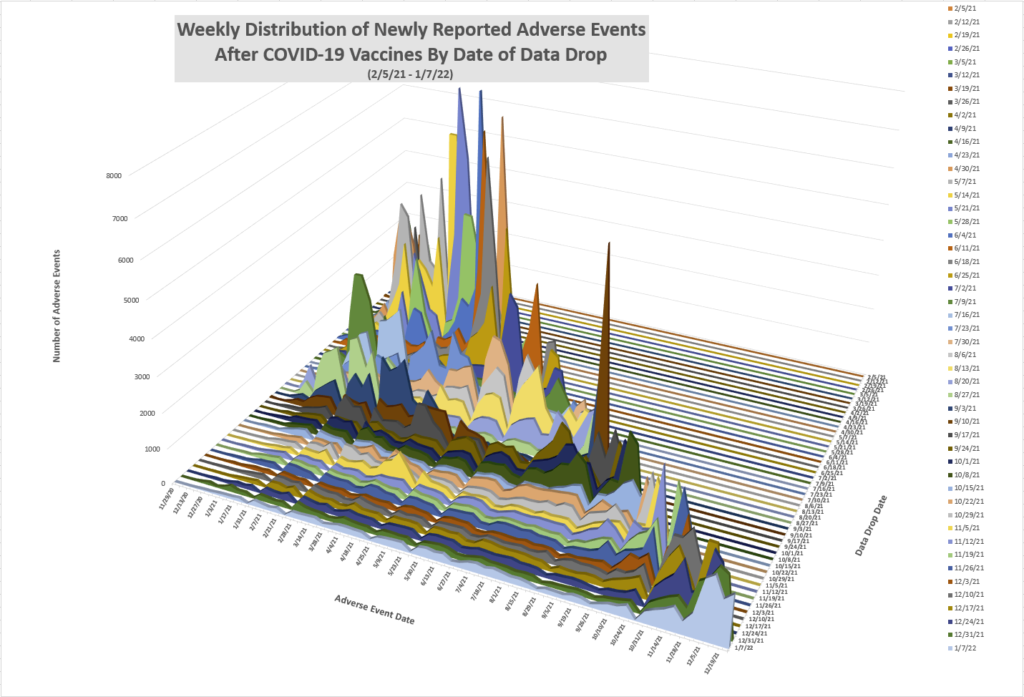
Update 1/07/22: New chart posted.
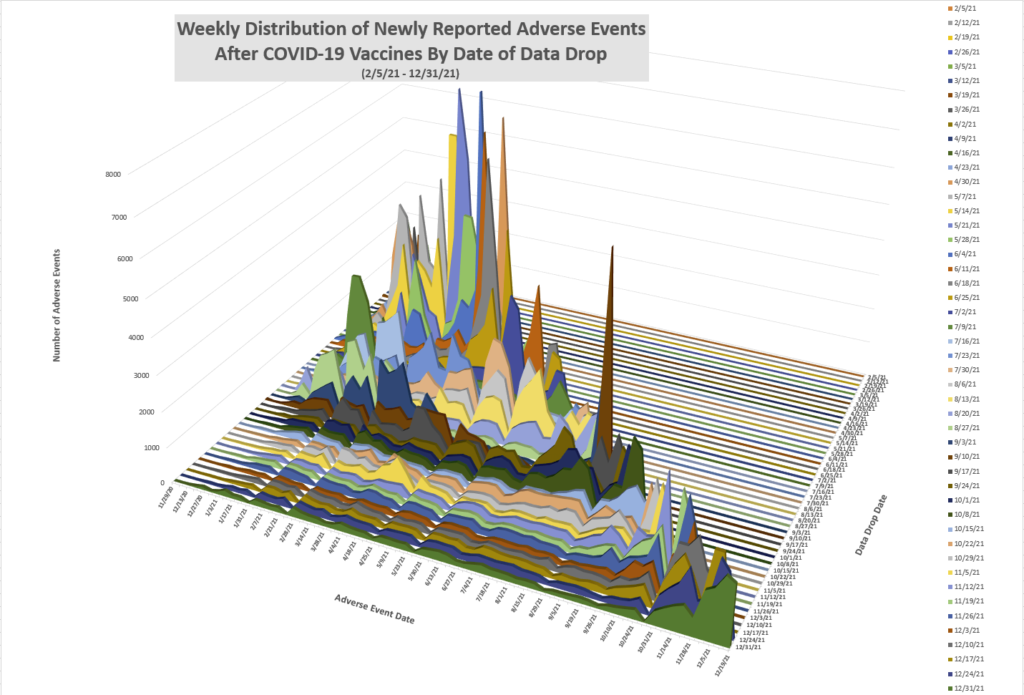
Update 12/31/21: New chart posted.
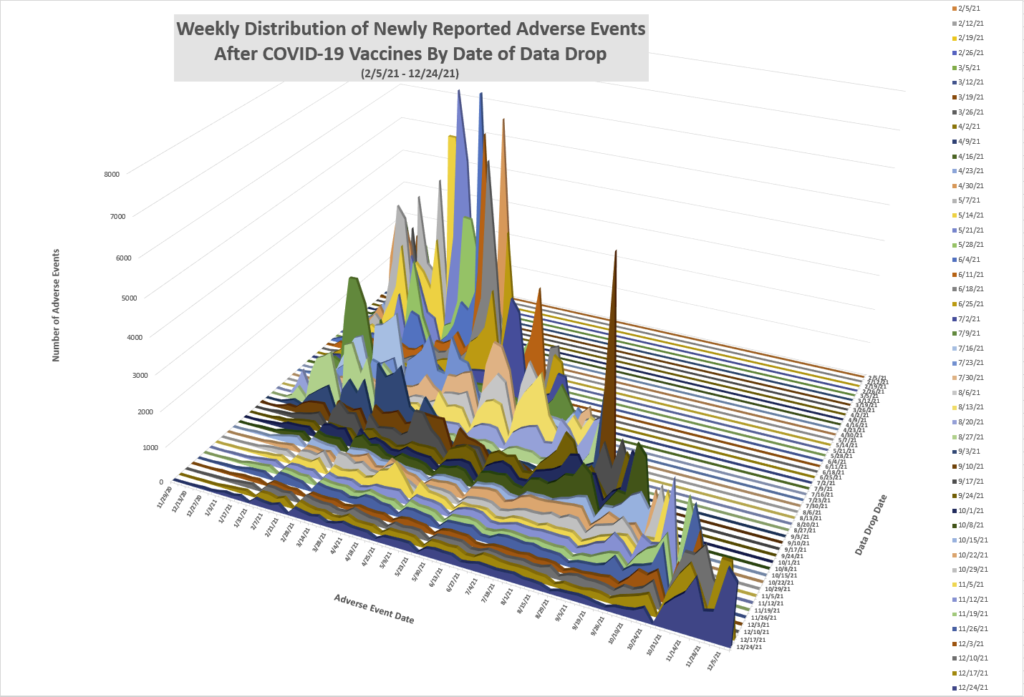
Update 12/24/21: New chart posted.
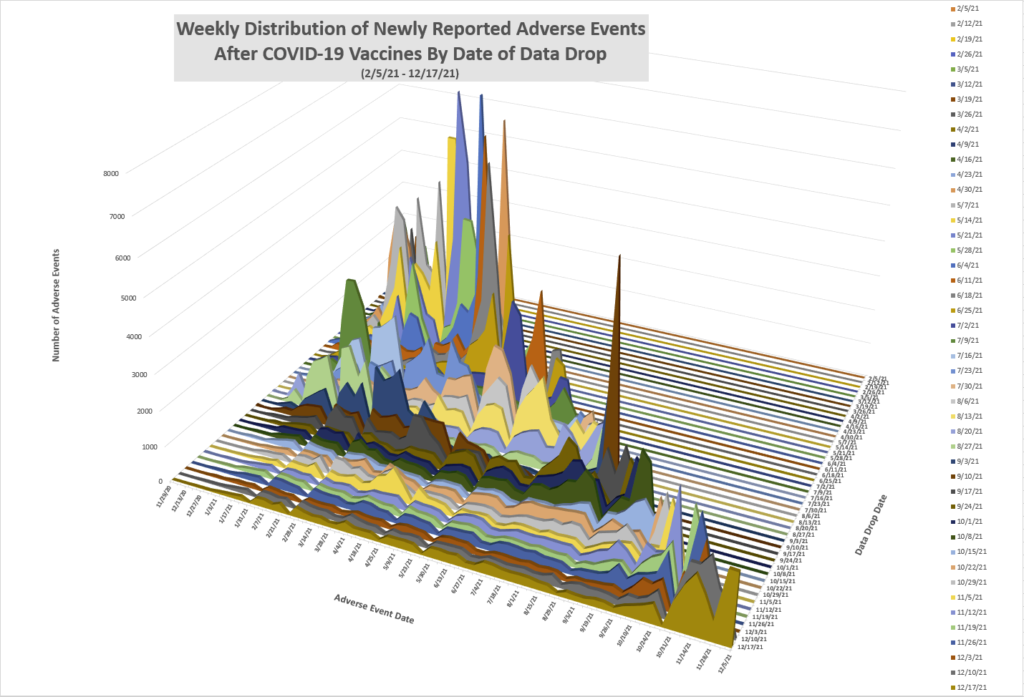
Update 12/17/21: New chart posted.
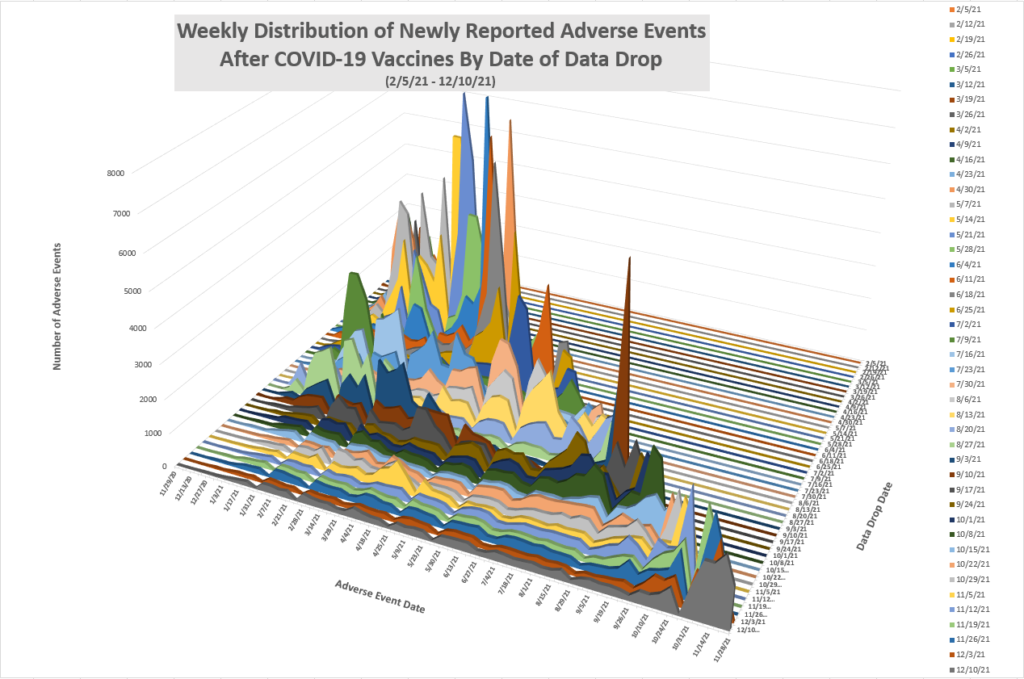
Update 12/10/21: New chart posted.
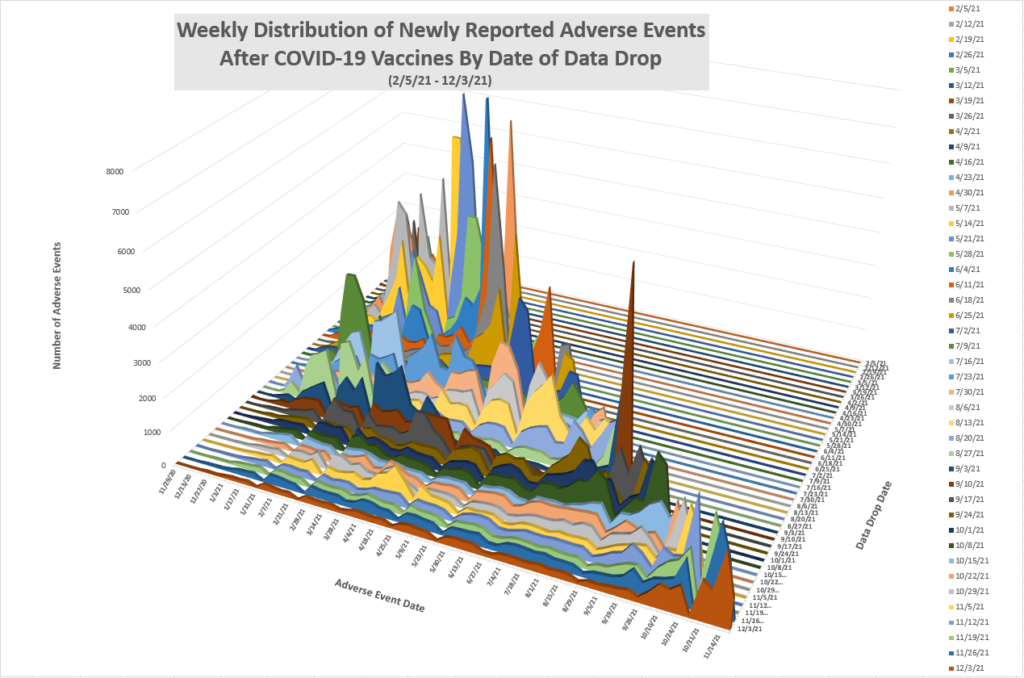
Update 12/3/21: New chart posted.
Update 12/1/21: New chart posted.
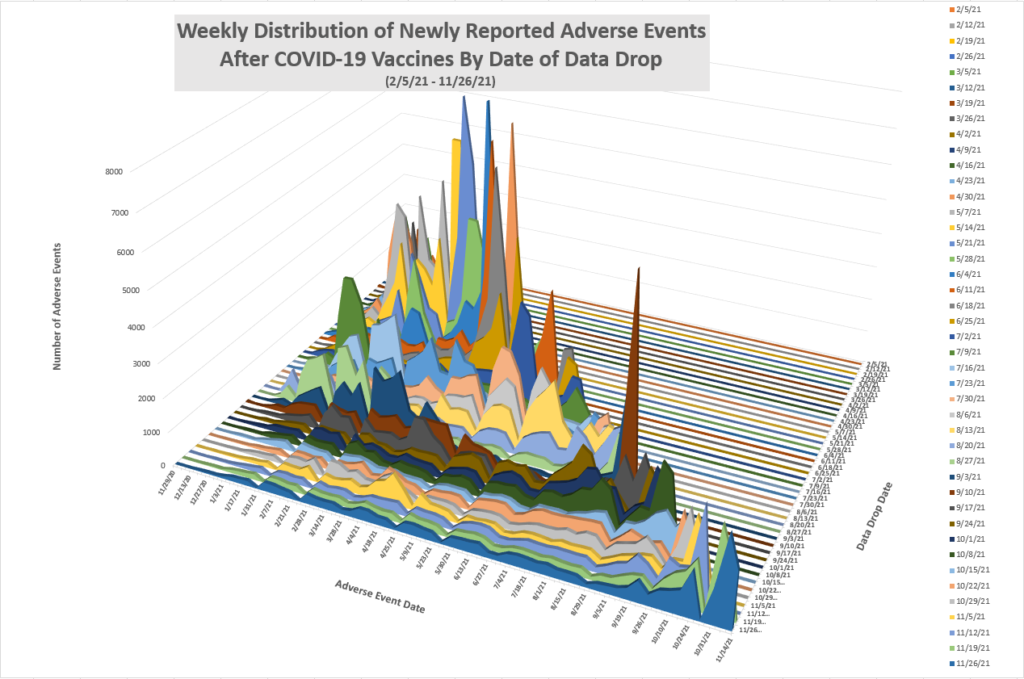
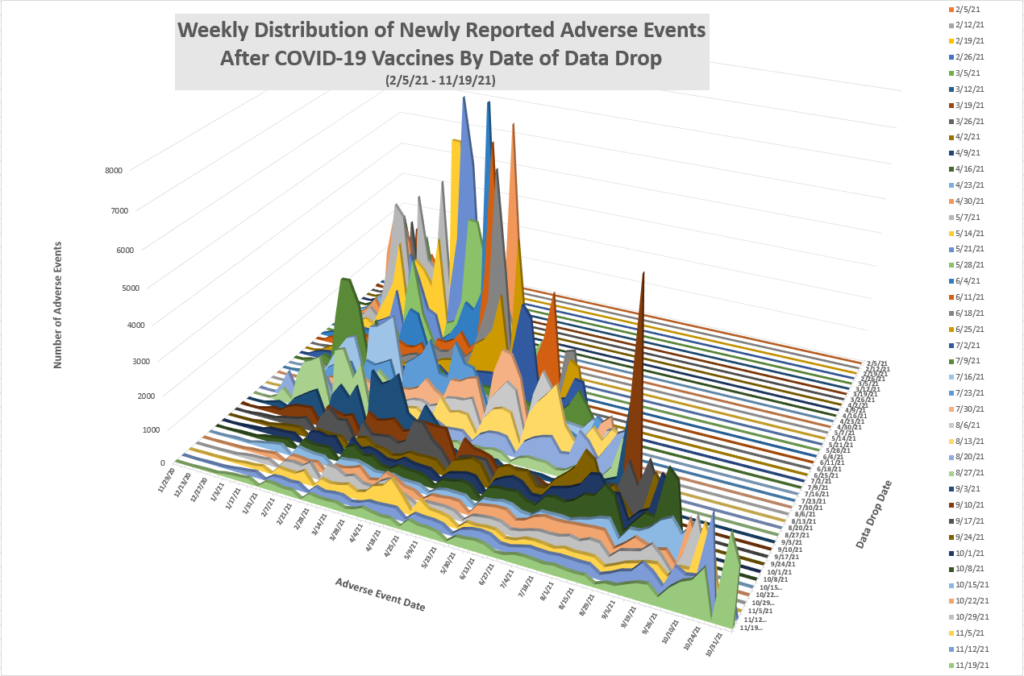
Update 11/19/21: New chart posted.
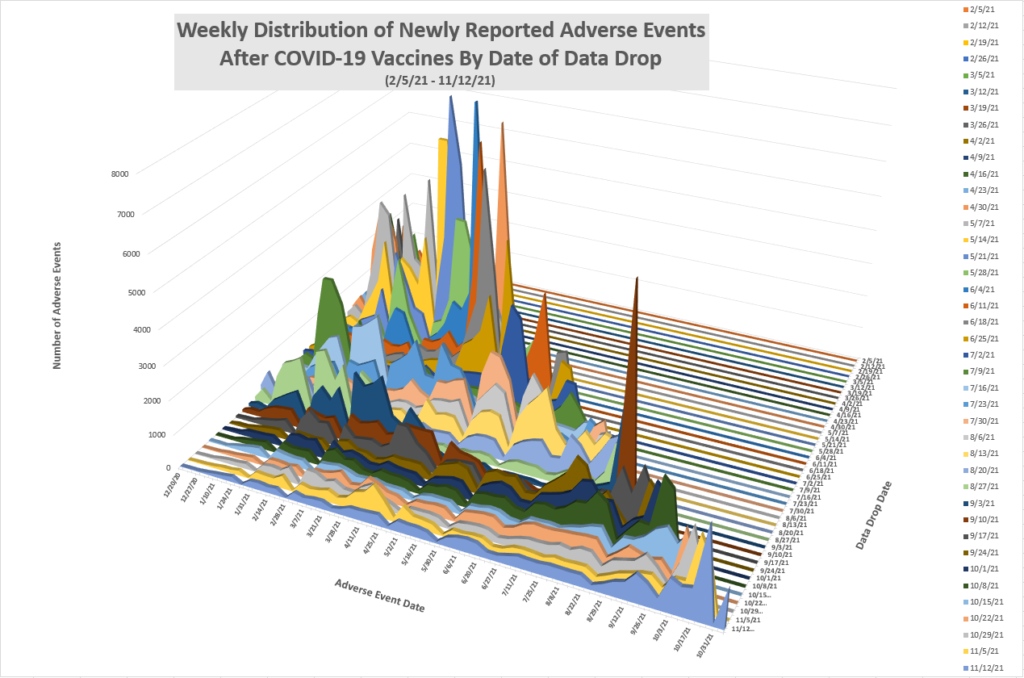
Update 11/12/21: New chart posted.
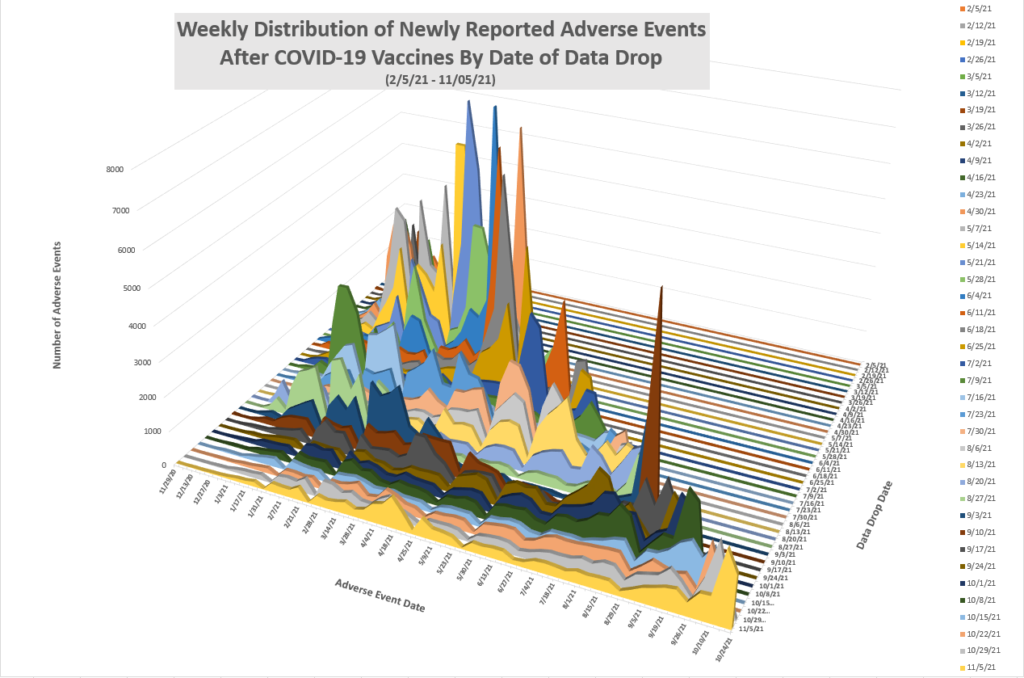
Update 11/05/21: New chart posted.
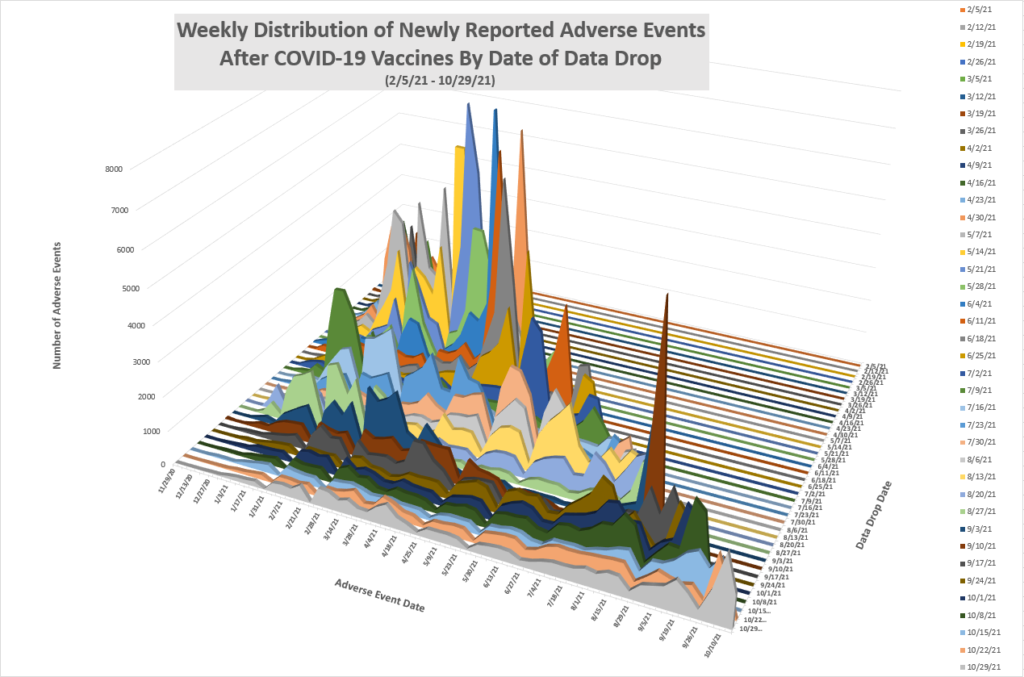
Update 10/29/21: New chart posted.
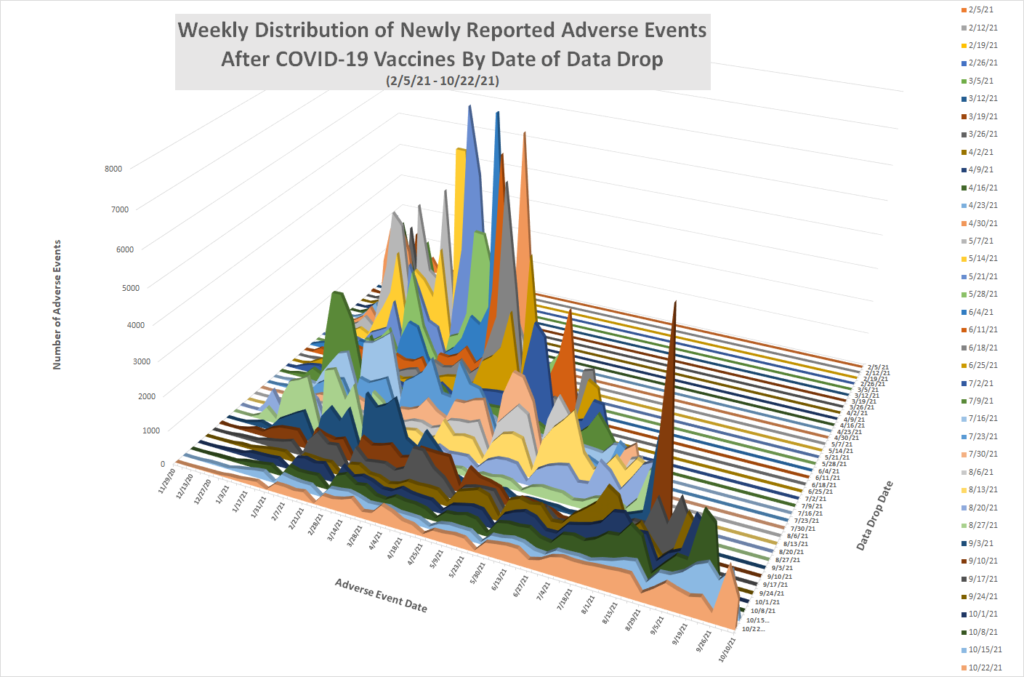
Update 10/22/21: New chart posted.
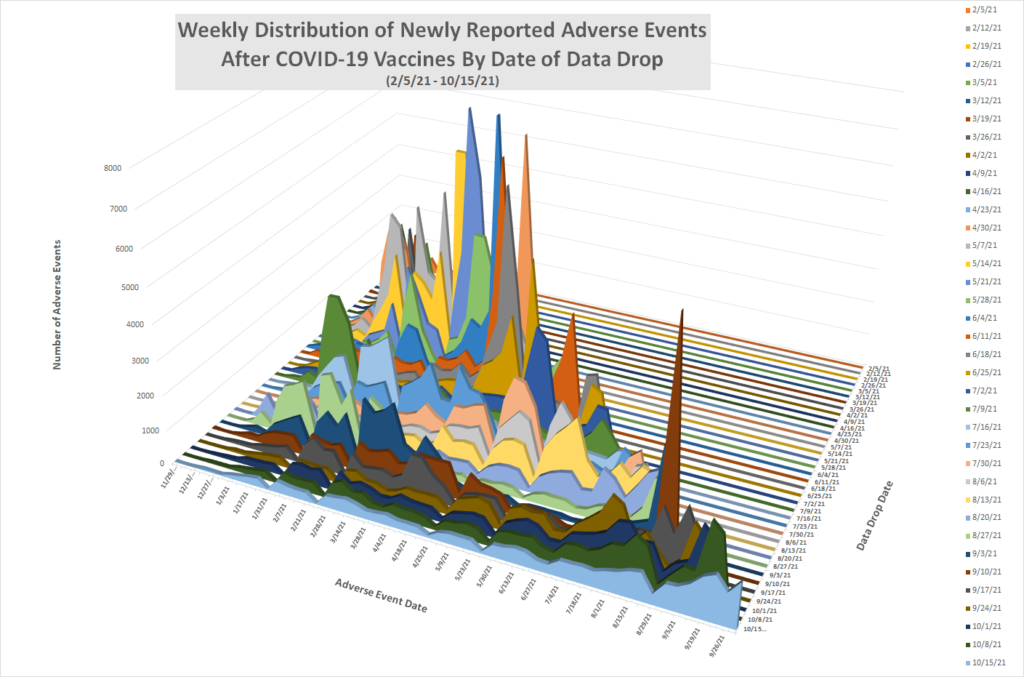
Update 10/15/21: New chart posted.
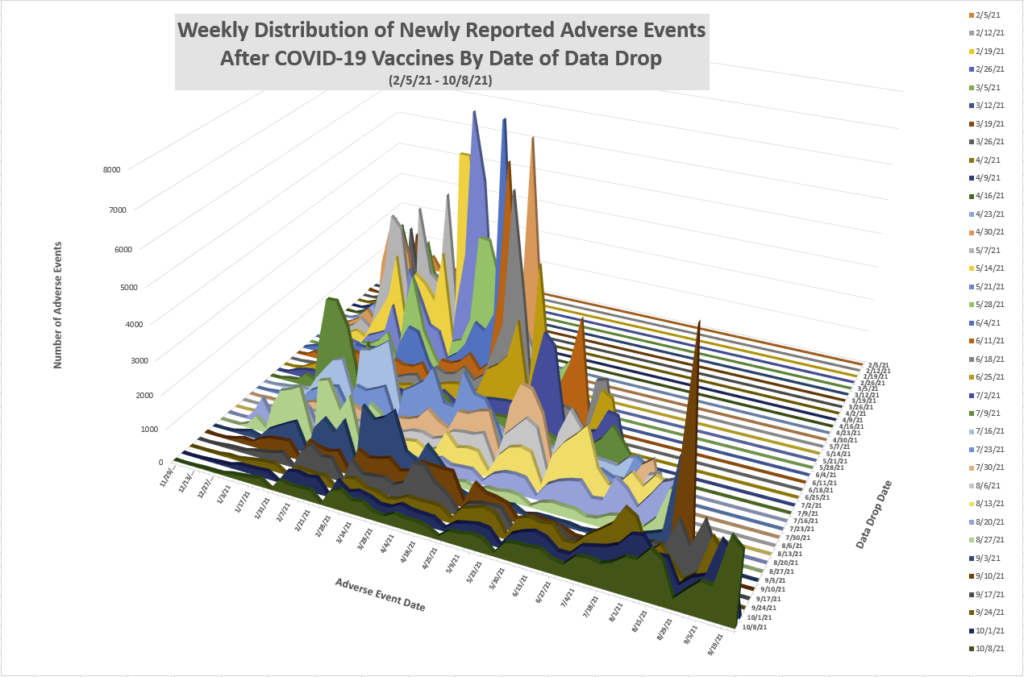
Update 10/8/21: New chart posted.
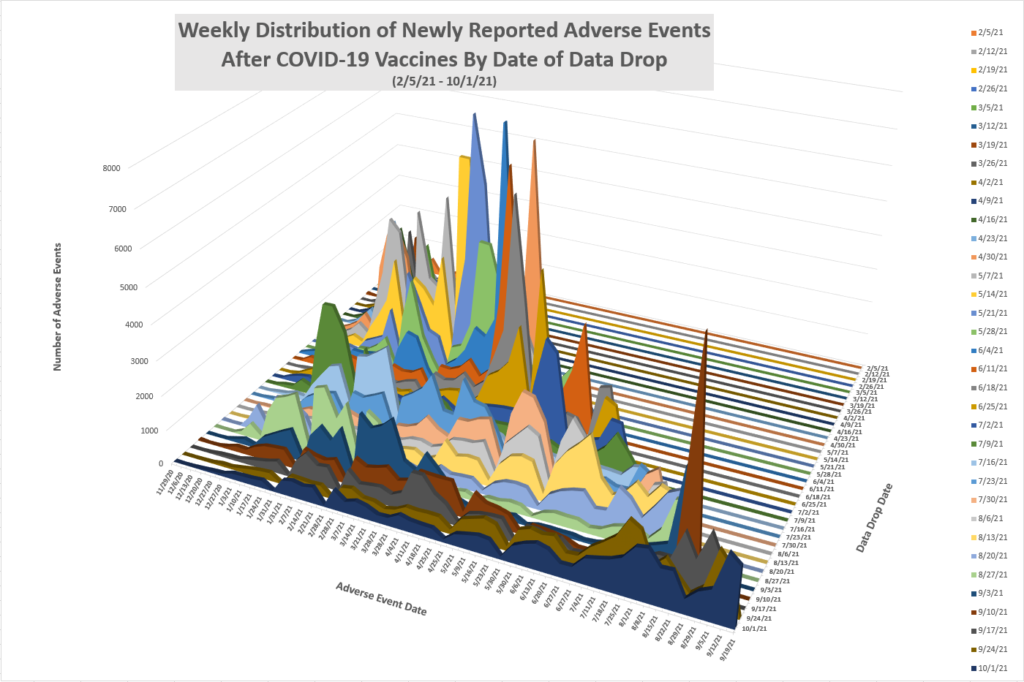
Update 10/1/21: New chart posted.
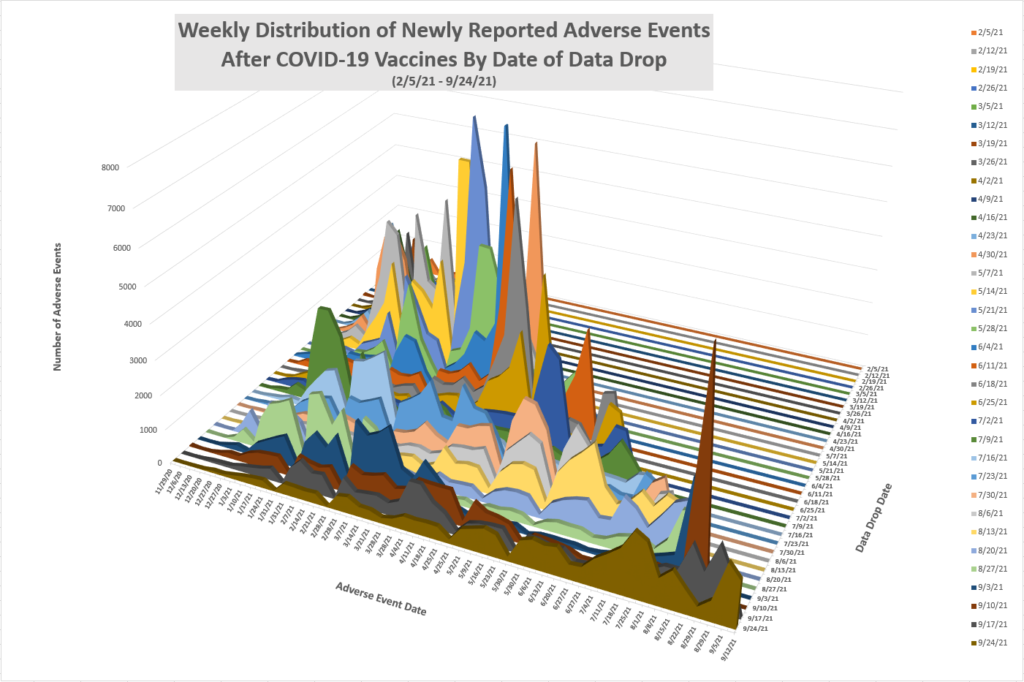
Update 9/24/21: New chart posted. Past three weeks have shown much less backfilling than previously, and a shift towards reporting recent events in instead.
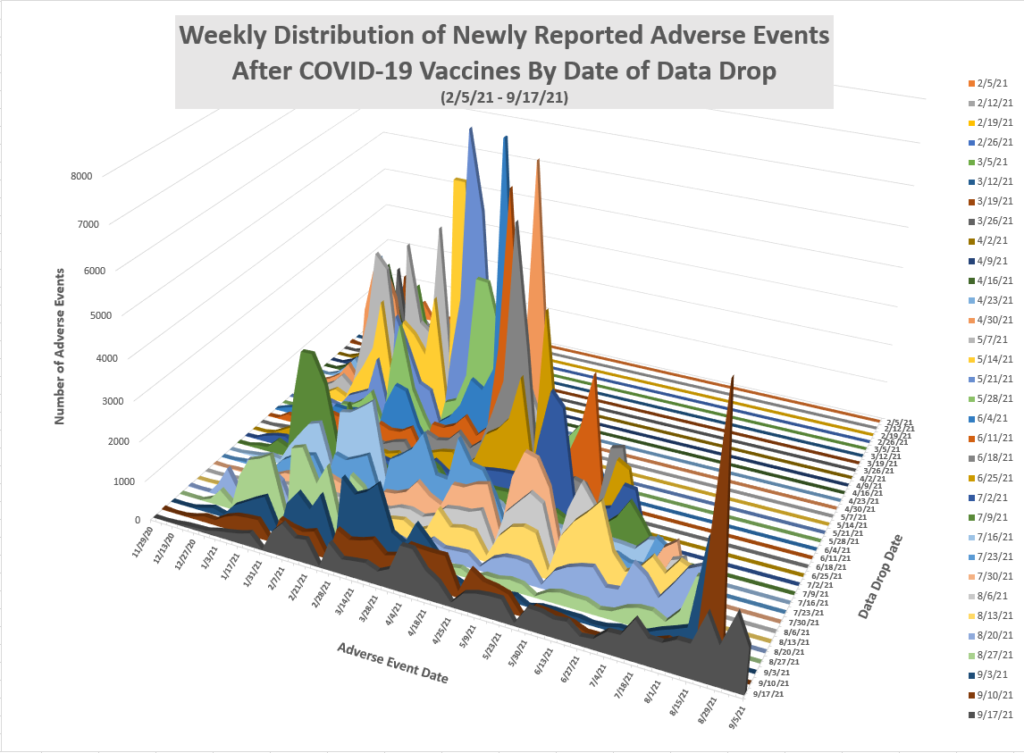
Update 9/17/21: New chart posted.
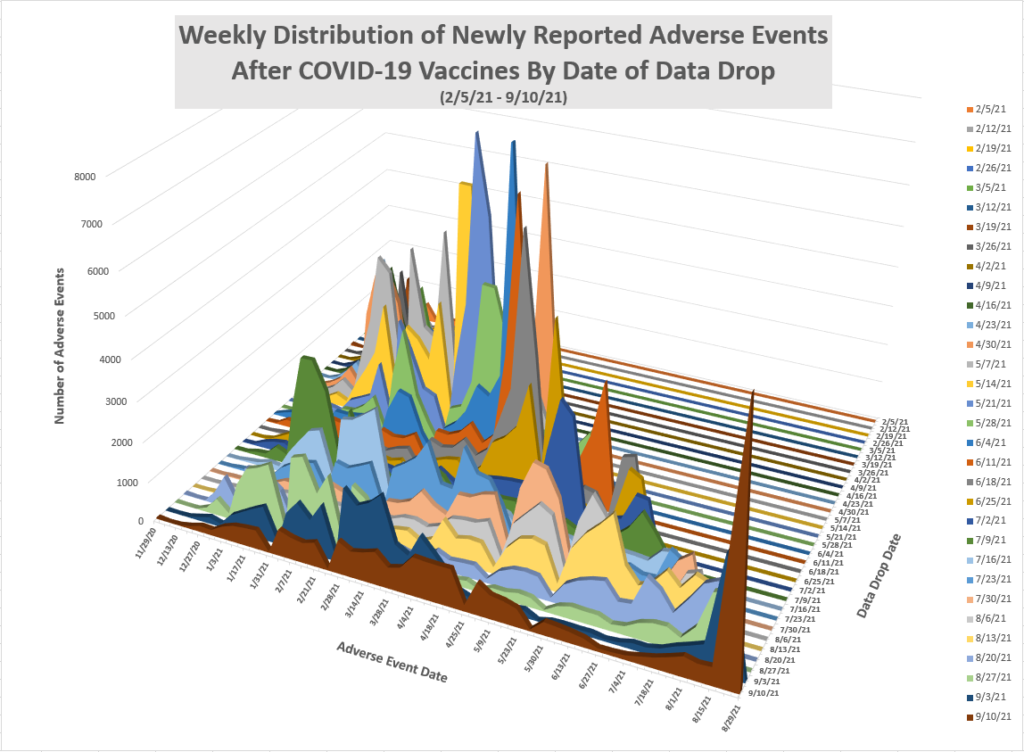
Update 9/10/21: For the first time in a long time, we have a distribution of newly added VAERS records which includes a large spike of reported events with dates in the very near term. 25% of all the newly added VAERS records for this week had events dates in the one week period starting 8/22.
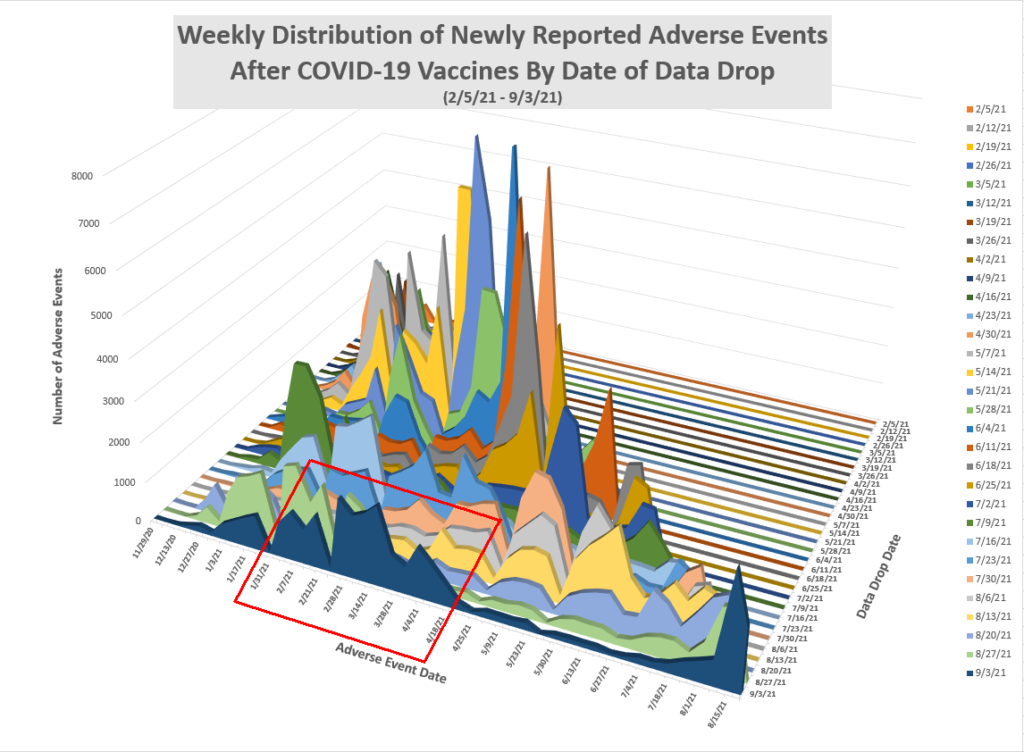
Update 9/3/21: 65% of all newly reported adverse events this week were for event dates from 4/10 or earlier.
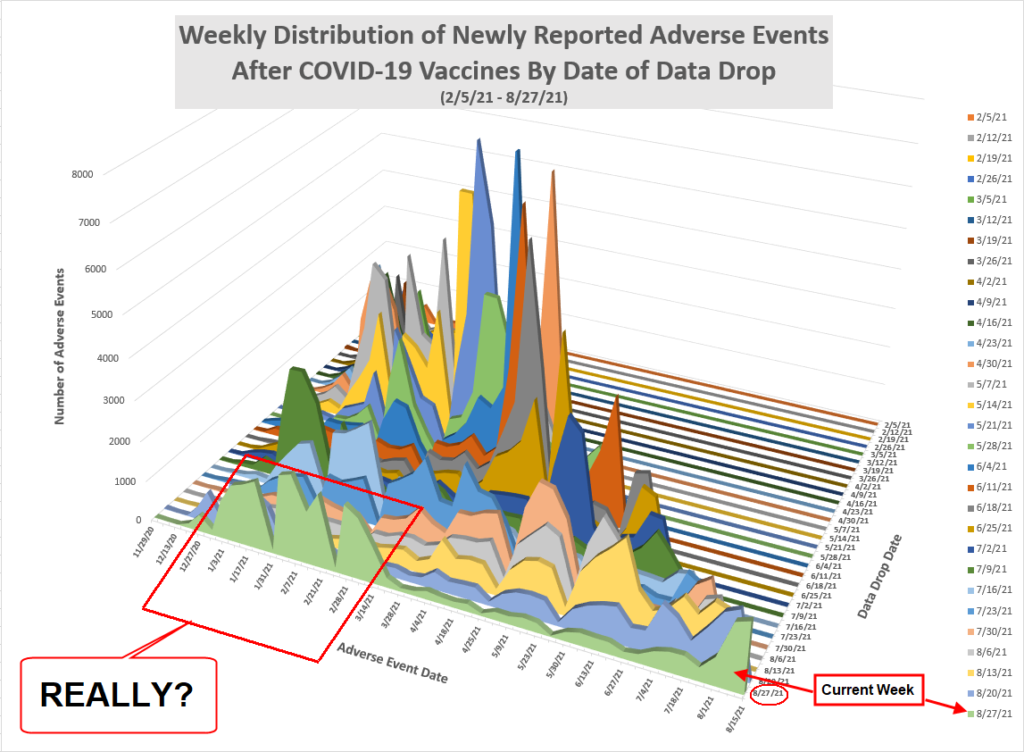
Update 8/27/21:
Looks pretty criminal: A full 62.2% of all newly reported adverse events this week were for event dates 5 months ago or more.
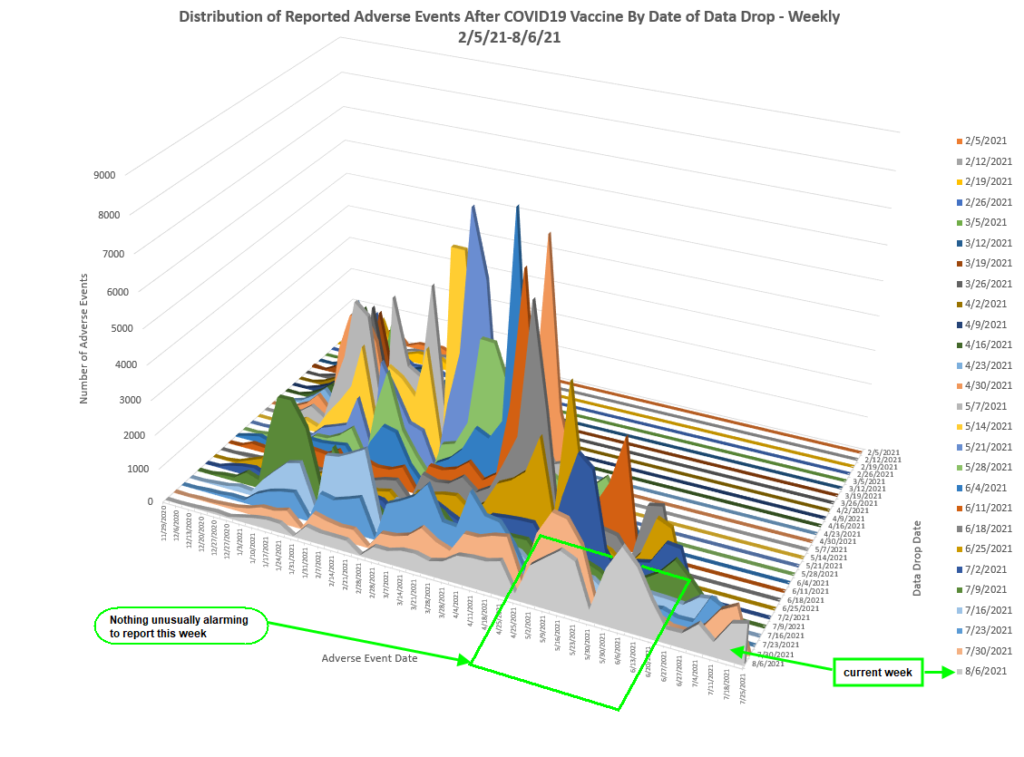
Update 8/6/21:
Nothing unusually alarming to report this week.
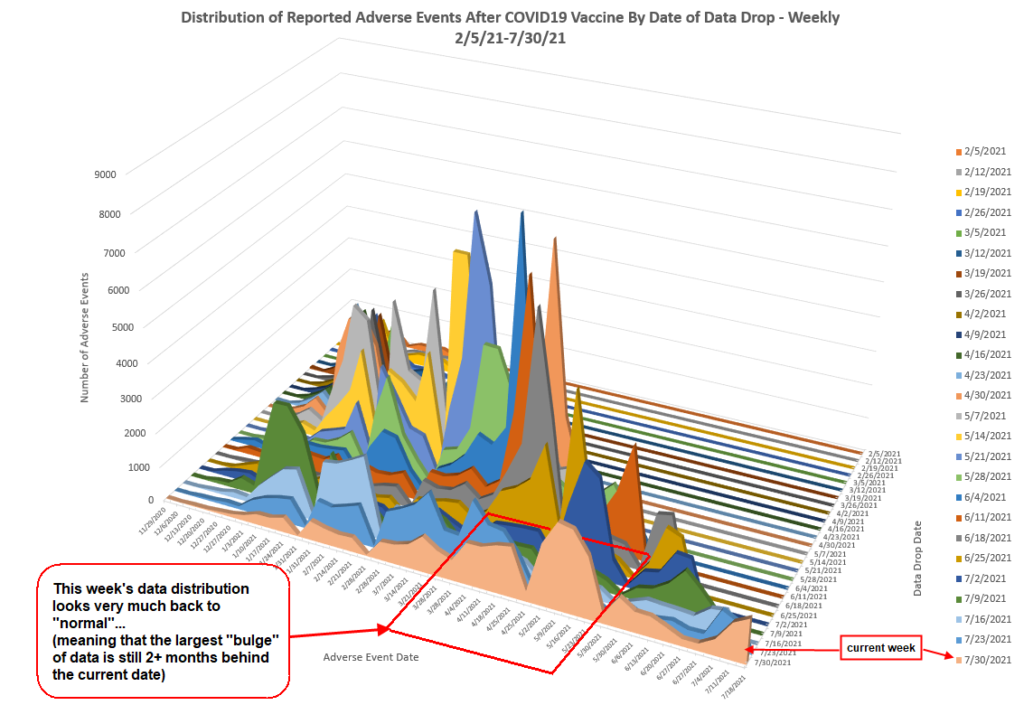
Update 7/30/21:
It appears we are back to “normal”.
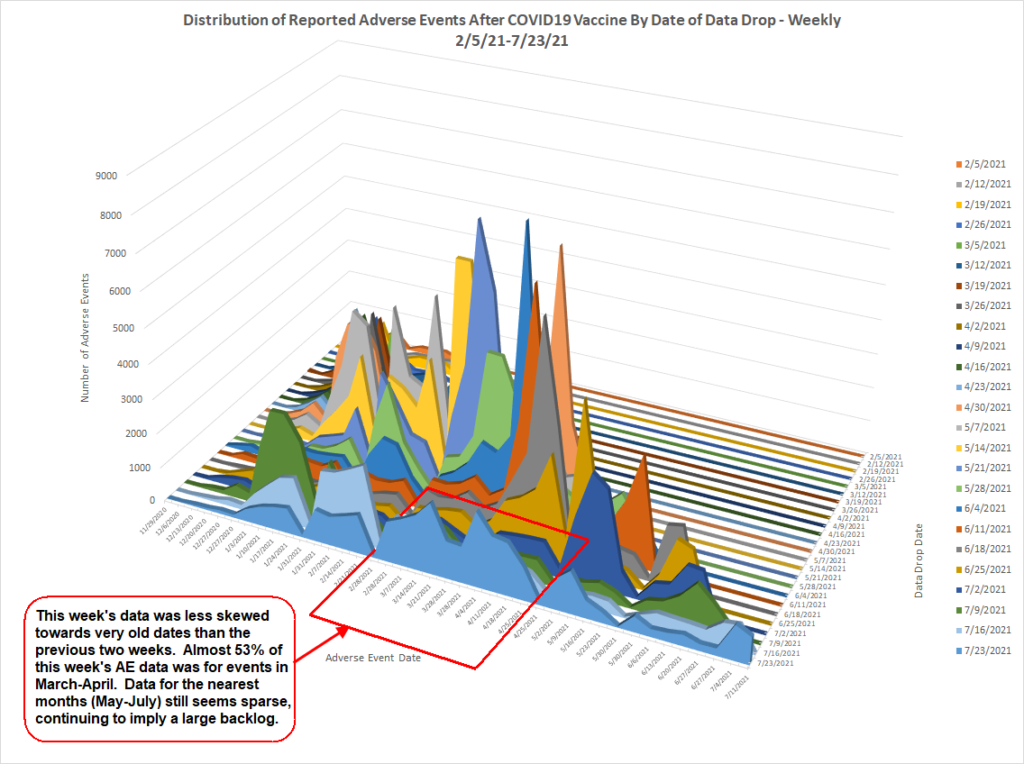
Update 7/23/21:
This week VAERS appears to have resumed it’s normal programming, giving us a large helping of older adverse events and a much smaller portion of newer adverse events. The bulge of data centered around March and April implies that VAERS is behind in its reporting by a couple months or more.
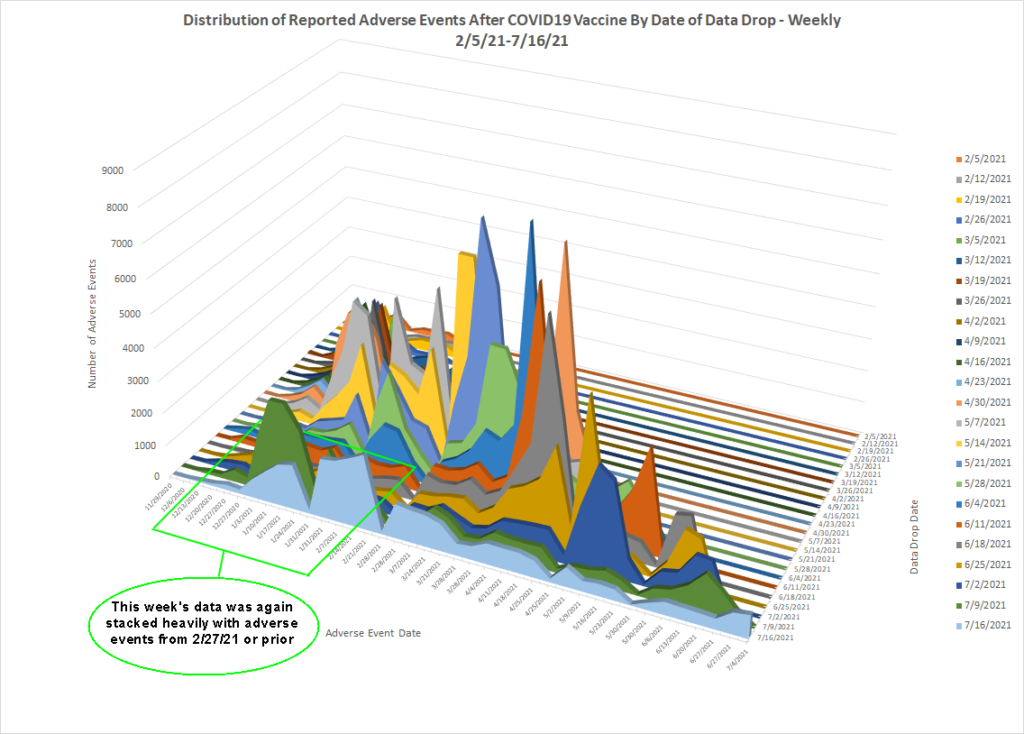
Update 7/16/21:
For the second week in a row, the newly added VAERS records were heavily stacked with adverse events from 2/27 or prior. Events from 2/27 or prior comprised 52% of all the VAERS records this week.
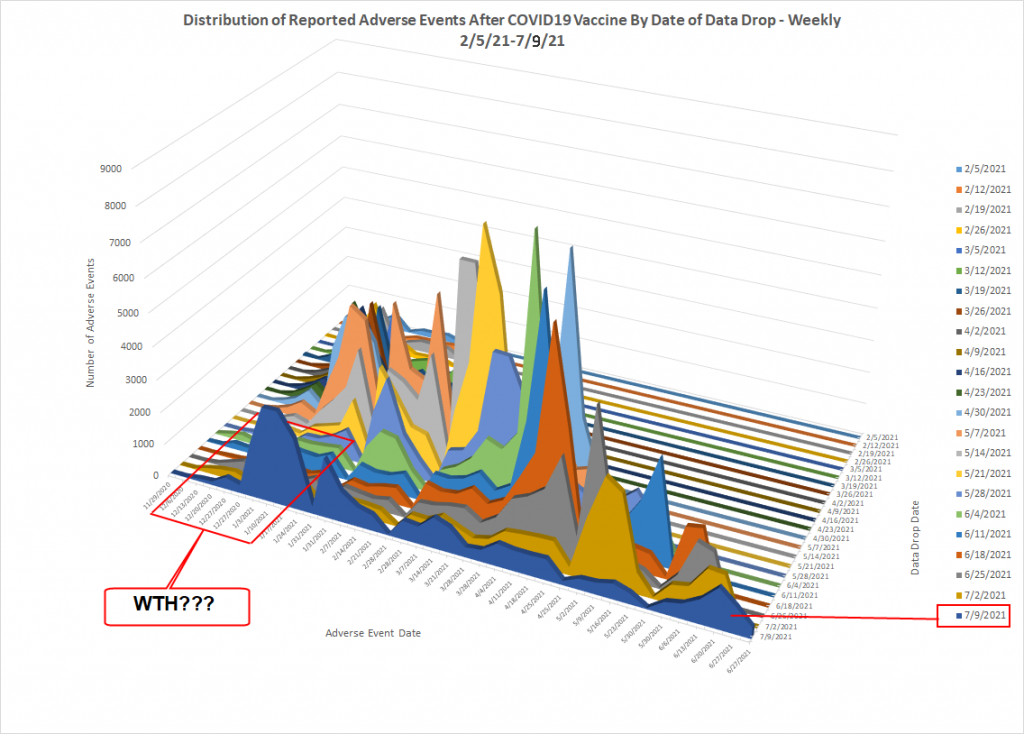
Originally posted 7/9:
This week VAERS took a major step backwards in catching up on its backlog of reports. Rather than seeing more reporting of recent adverse events, almost 48% of the reports were for adverse events occurring on 2/6 or prior. This completely breaks with the trend of the last several weeks, where the CDC, while obviously being way behind, was at least attempting to show they were trying to catch up on its backlog of reports…WTH is the CDC doing???
This is a remarkably effective visualization. If readers don’t recognize what it’s saying, please keep trying.
The VAERS reports are mostly backdated, which proves again and again that the backlog is massive.
Thank you for this analysis Wayne.
Max,
Thanks for your generous compliment…also thanks for all the work you are doing as well @ vaxoutcomes.com
and @WayneTheDBA Amazing work. Depressing but important. Thank you both.
Thanks for the kind words OX!
I’m kind of shocked, or maybe confused… Why is the large spike shifting and then disappearing in more recent data drops? having the curve increase.. yes that makes sense. But having it shrink, I don’t understand why that would happen. They are deleting false reports or something?