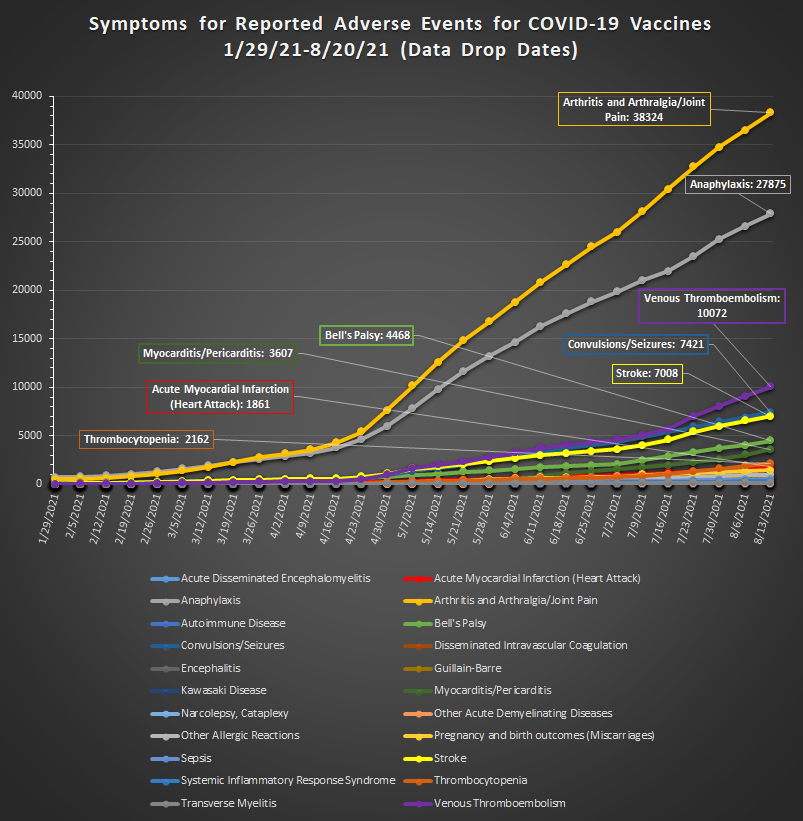
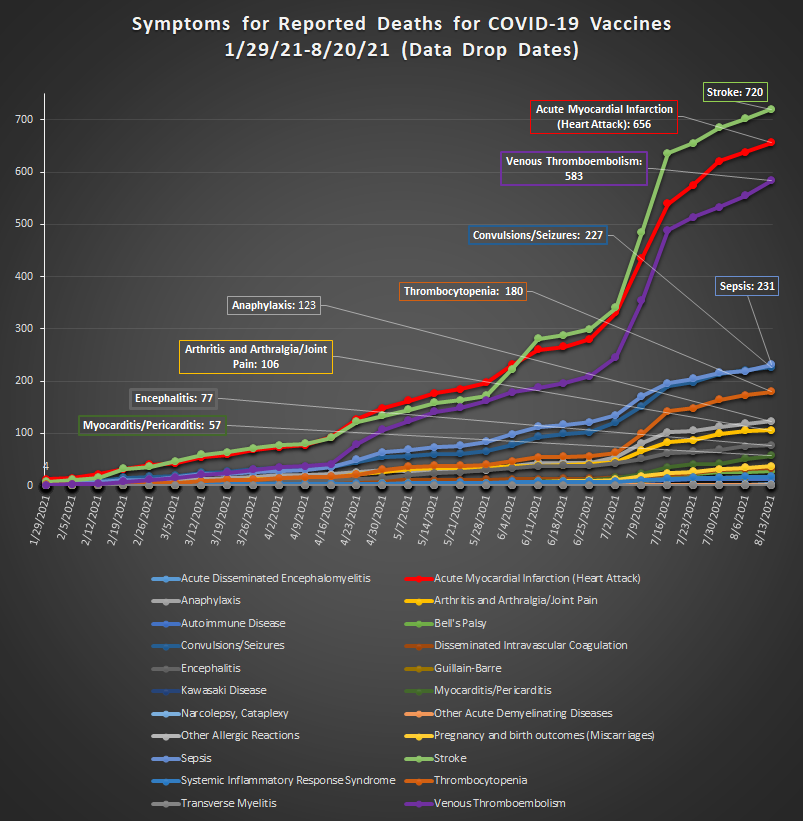
Here are graphical summaries showing the weekly trend of adverse events and deaths classified by symptoms for the Covid-19 vaccines, updated to 8/20/21.
Adverse Events:
Deaths:
Weekly analysis of the VAERS data
Here are graphical summaries showing the weekly trend of adverse events and deaths classified by symptoms for the Covid-19 vaccines, updated to 8/20/21.
I just wanted to let you know I really appreciate what you do. I just recently found this site and I’ve been checking back for weekly updates. Even shared a few times to facebook and today I got a notice that my posts would be throttled for sharing this “misinformation”. Haha! It’s just data. Chill, Facebook. Anyway, thanks a bunch. ?
Thanks! I post this stuff exactly so that people like you can also share on FB and such (I do not use FB since I’ve never subscribed to the philosophy of being spied upon). The fact that FB gave you notice that this is misinformation means we are spot on and right over the target.
I appreciate the data. A cumulative total “deaths” or “infections” or “vaccines” shown for each breakout chart would be bomb. ie:
it looks like the 1/29 – 7/23 death break out has a total of 2593 deaths in X number of days or 82,958 serious side effects for X number of days … this would make comparing per detected COVID infections, per 2.5 million vaccine doses or reactions to 2nd dose of Moderna, etc.