Since the CDC has chosen egregious dereliction of duty in not performing the weekly PRR Analysis as specified in their VAERS Standard Operating Procedure document of Jan 29, 2021, it will be provided weekly here instead.
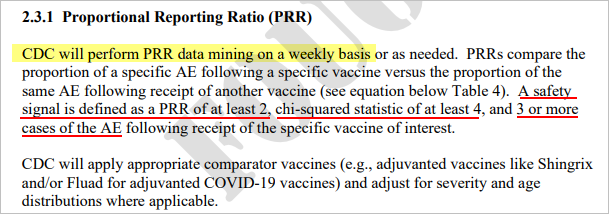
Using the CDC’s methodology to perform the PRR Safety Signal analysis, the Covid-19 vaccines will be compared to all other vaccines combined, and then also separately compared to the Flu vaccine and the Shingles vaccine, as suggested in their document. The analysis will include Adverse Events of Special Interest (as defined by the CDC), in addition to other select adverse events that are also of high interest. The analysis will include stratifications by age and by seriousness. The time frame for analysis will be 12/2020 to present for the Covid-19 vaccines, and 1990 to present for all the other vaccines. We will be using US data only. Corrections have been made for missing age and death data (over 20% of records are missing age data which is clearly available in the narrative description) for this analysis.
This week’s PRR Analysis uses the VAERS data files released on 3/24/2023 (data through 3/17/2023).
Graphical High-Level Summary:

For Covid-19 Vaccines vs. NonCovid-19 vaccines:
For Covid-19 Vaccines vs. Flu Vaccines:
For Covid-19 Vaccines vs. Shingles Vaccines:
On the first graphic, black background and blue bars, it is not clear to me what the numbers mean as the chart doesn’t specify – 2.2 of how many? Thank you for doing this important work.
I’m sorry that I didn’t understand the numbers but I re-read the post and now I do know what these numbers represent, although no idea about all the mathmatical terms.