“We’re never going to learn about how safe this vaccine is unless we start giving it. That’s just the way it goes.”
–FDA Panelist, October 26, 2021, at the 170th Meeting of the Vaccines and Related Biological Products Advisory Committee
Say What??? With the FDA on the cusp of issuing an EUA for the Covid-19 inoculations for children ages 5-11, it is now time to show how it is completely unconscionable to be injecting children with these experimental products. The statistics are clear: children are at effectively negligible risk of dying from the Covid-19 disease, compared to the elevated risk of both death and serious injury from these shots. It is absurd to think that the health “benefits outweigh the risks” for children and that they therefore need to get the shots to be protected from the Covid-19 virus. We are now going to demonstrate this using the numbers from the CDC and VAERS (and the US Census for the US population number). We will take this data and build an Excel spreadsheet containing multiple tabs.
If you would rather skip the details, here is the final conclusion for this exercise:
Based on the CDC data and VAERS, children under the age of twelve are 188 times more likely to die from the Covid-19 jab than from the Covid-19 disease, assuming that VAERS has an underreporting factor of 40 (ie. 2.4% of all adverse events are reported to VAERS). Furthermore, if we actually assume that VAERS does not underreport adverse events at all (which is not true), children under the age of twelve are still almost 5 times more likely to die from the Covid-19 jab than from the Covid-19 disease.
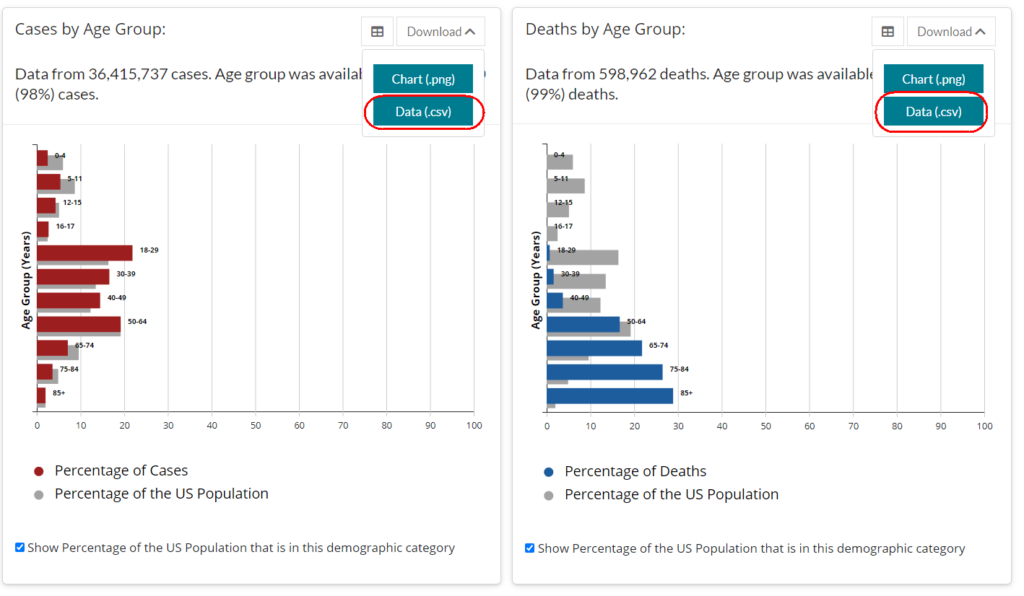
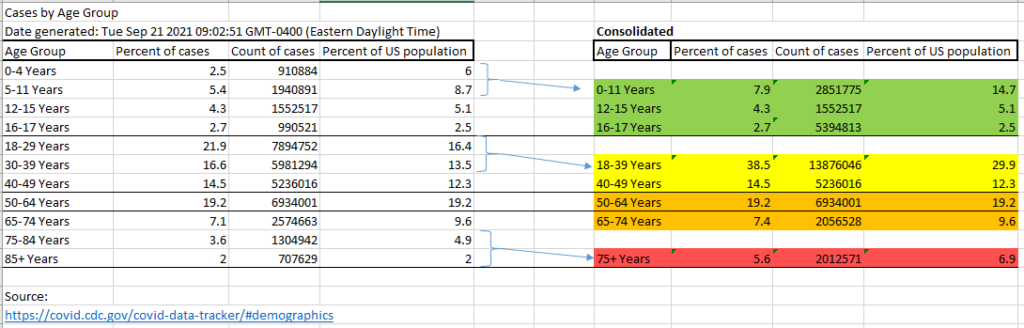
First we will go here: https://covid.cdc.gov/covid-data-tracker/#demographics to download the “Covid-19 Cases by Age Group” data and the “Covid-19 Deaths by Age Group” data. It should look like this somewhere in the middle of the webpage:
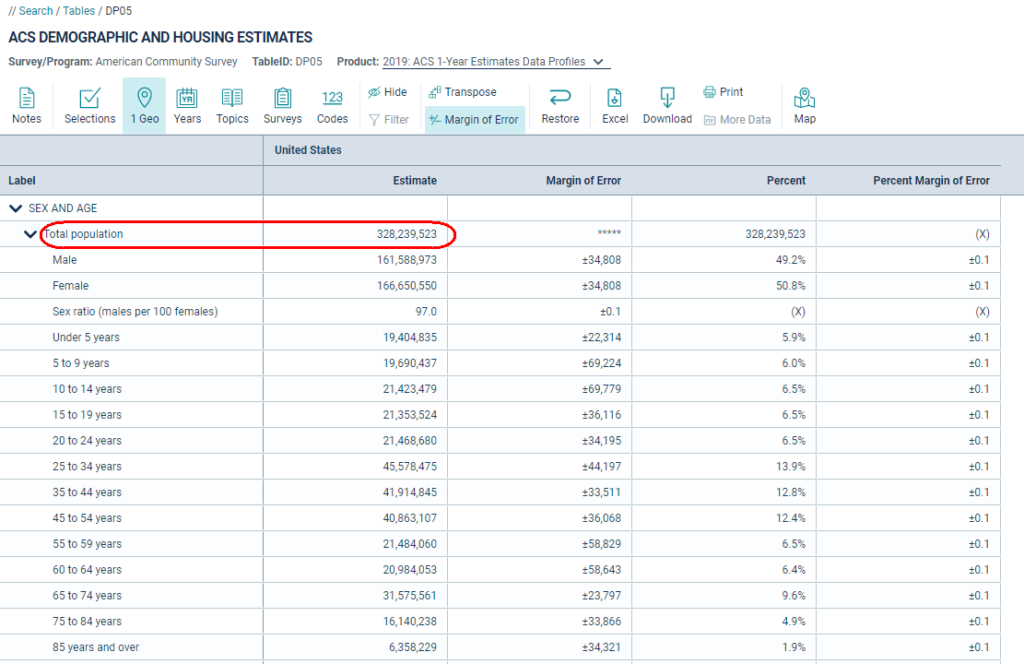
Next we will go to the US census to get the estimated total population of the US: https://data.census.gov/cedsci/table?q=United%20States&g=0100000US&tid=ACSDP1Y2019.DP05&hidePreview=true
Table ‘DP05’ contains the data needed.
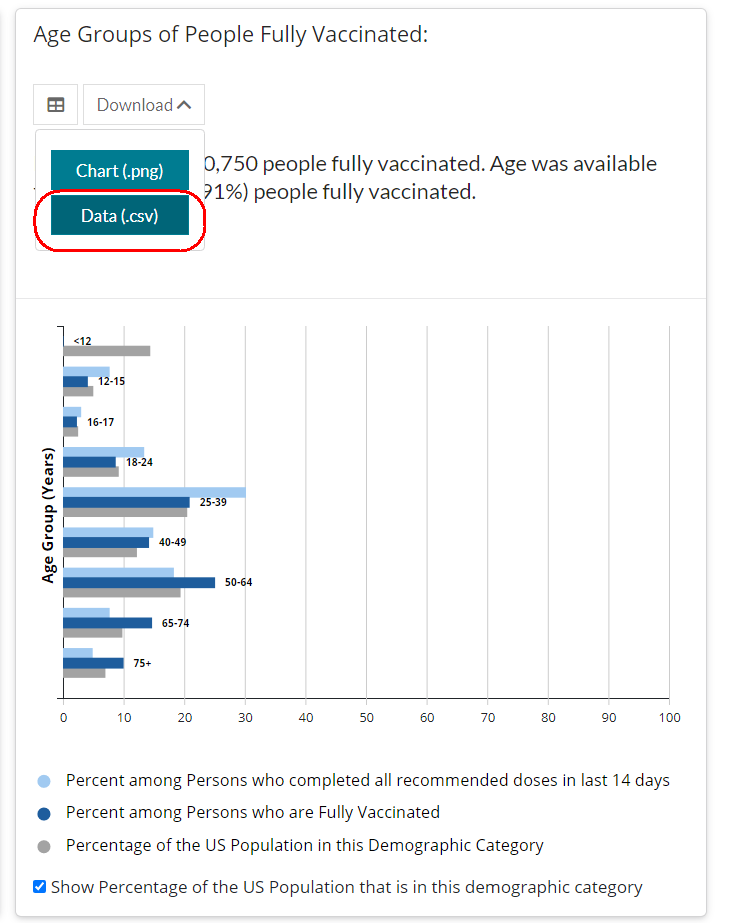
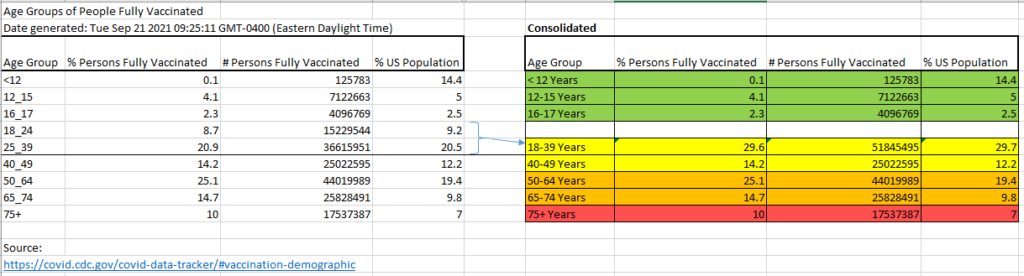
Next, we will go here: https://covid.cdc.gov/covid-data-tracker/#vaccination-demographic to get the data for the fully vaxxed people by Age. This is what it looks like on the webpage:
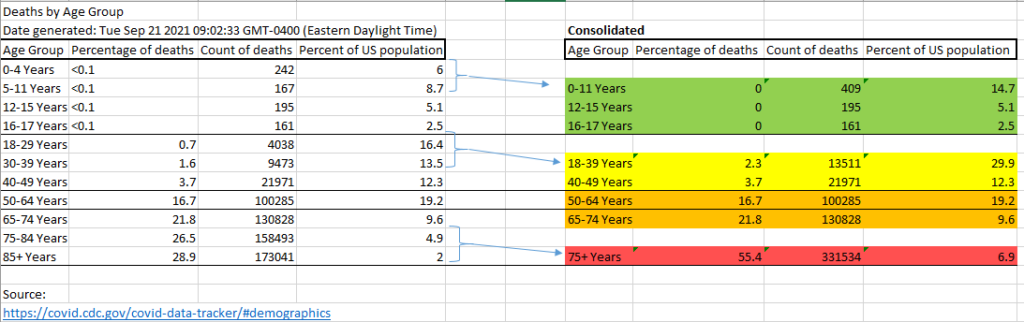
Since the age group classifications are slightly different between the vaccination data and the case/death data , we need to make them consistent. We will do that by consolidating the case/death data into the same group classifications as the vaccination data. See below:
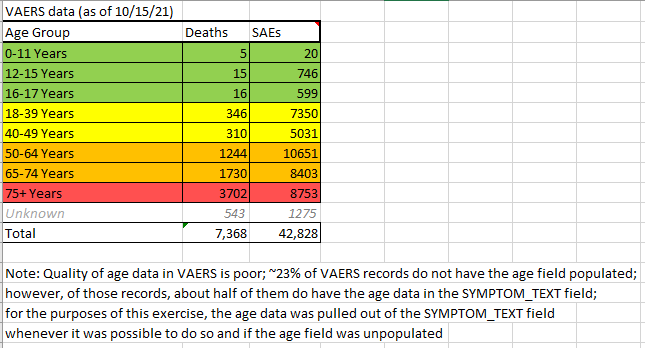
Next we get the VAERS death and serious adverse event data (US only), segregated by the same age groups:
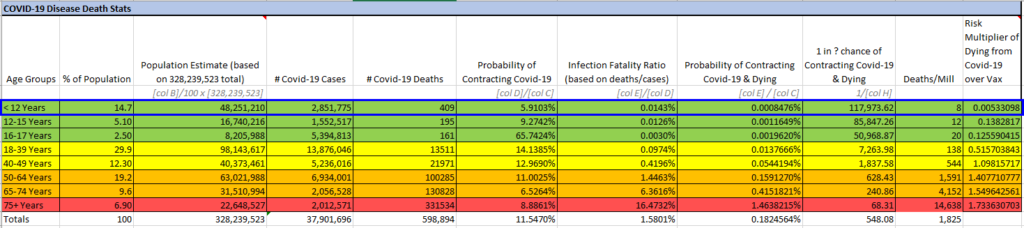
We then paste each of these 4 data sets as separate sheets into our Excel file. Using this data, along with the census number for the total population of the US, we build a master sheet collating the data and then creating tables for each of the following: Covid-19 Disease Death stats, Covid-19 Vax Death stats, and Covid-19 Vax Severe Adverse Event stats. Note that since we are focused on the under 12 age group today, the first row in each of these tables below is highlighted in blue.
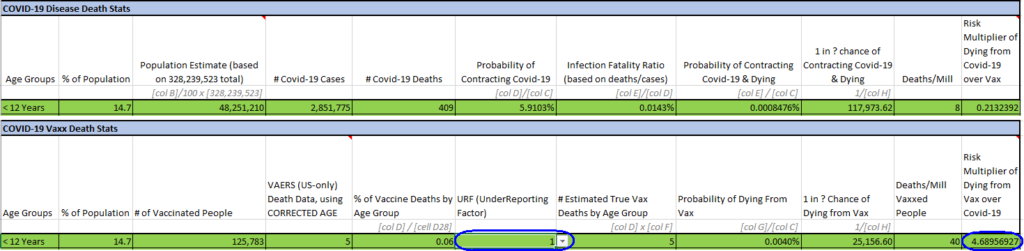
The Covid-19 Disease Death table looks like this:
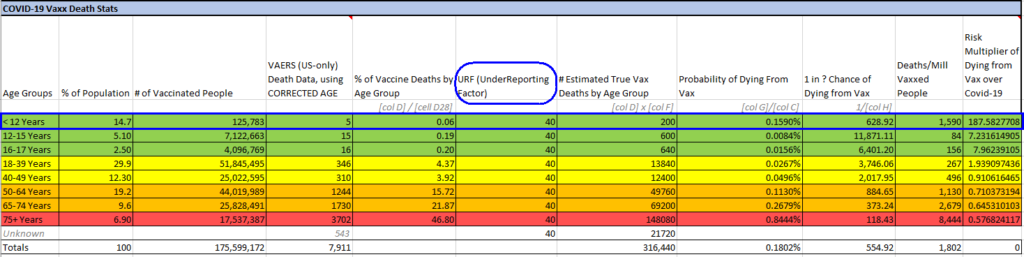
The Covid-19 Vax Death table looks like this:
The Covid-19 Vax Severe Adverse Events table looks like this:

If we hone in on the Covid-19 Vax Death table, note that there is a middle column containing the URF (under-reporting factor), which represents the multiple that you need to use to account for the under-reporting in VAERS. The URF being used above is 40. As a reminder, the CDC admits that one of the biggest limitations of the VAERS system is that it suffers from under-reporting. In fact, in 2011, the results of a CDC-commissioned study (the Lazarus study) concluded that less than 1% of all adverse events are ever reported to VAERS, and that number has never been seriously contested. A 1% reporting rate in VAERS would correspond to a URF of 100. Others more recently have come up with their own URFs as well — Kirsch/Rose/Crawford have concluded that the under-reporting factor is about 41 (equivalent to a 2.4% reporting rate in VAERS).
Comparing the first two tables above, notice how the death rate from the Covid-19 inoculations is ~188 times higher than the death rate for the Covid-19 disease with the URF set to 40. What if we hypothetically assumed the URF was only equal to 1 (meaning there is no under-reporting at all in VAERS…though we know this to be false)? The death rate would still be higher for the Covid-19 inoculations; it would still be almost 5 times higher than the death rate for the Covid-19 disease (see screenshot below).
So why are we even considering giving it to children?
One can make the argument that some of the deaths in VAERS were not related to the shots, and that would be valid. However, we may never know the certainty of what those numbers are, since the CDC/FDA have abdicated their responsibility to investigate every report of death (If you claim they have investigated, then where is the proof? Where are the weekly/monthly reports which have been made public, as outlined in their SOPs?). One way to know with greater certainty would have been to carry out autopsies (though those have been largely prevented or highly discouraged). We could certainly discount some of the deaths in VAERS by using an estimate for the causal/non-causal ratio based on autopsies that have been done. Perhaps we could use Schirmacher’s results (showing 30-40% of autopsies show a causal relationship to the injections) in order to reduce the number of deaths caused by the Covid injections. Or perhaps we could use Burkhardt and Lang’s results, who showed that 7 out of 9 autopsies (78%) were likely causally linked to the injections? Or perhaps the results from the autopsies out of Norway (13 out of 13 causally linked)?
At the same time, note that we have also not even accounted for the fact that Covid-19 death numbers were artificially inflated through multiple means. By the CDC’s own admission (see pic below), only 6% of all Covid-19 deaths were due to Covid-19 only, meaning the other 94% were deaths with Covid-19 along with 2.9 other comorbidities (on average).
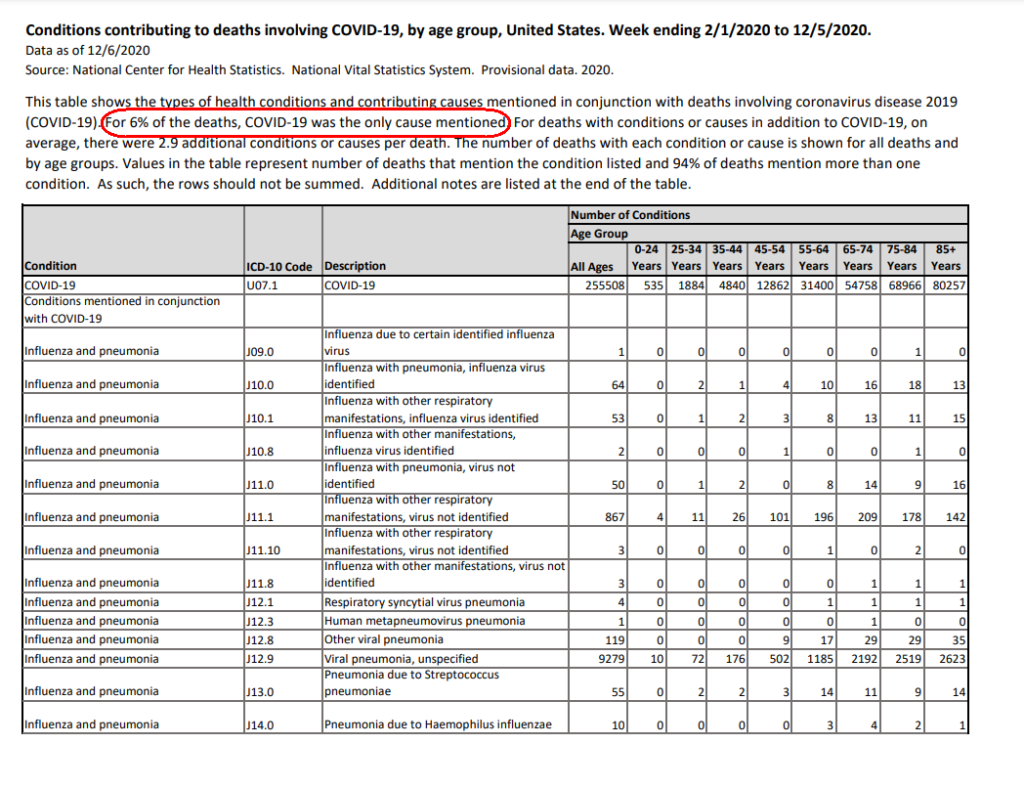
Historically speaking, if someone with existing comorbidities (eg. heart disease, diabetes, etc.) died with a minor illness, such as the flu or a coronavirus, the person would have been considered a death from complications due to the comorbidities, not actually from the flu or coronavirus itself. Furthermore, many hospitals were classifying deaths as Covid-19 if the victim had died within 28 days of a positive Covid-19 test. In this way, there were many cases of misclassification– people dying from things such as car accidents and gunshot wounds who were incorrectly classified as Covid-19 deaths. We will not even bother to address the fraud behind PCR testing, either.
Let us conclude then, by repeating what we said at the outset: the idea that children need to be vaccinated with the Covid-19 inoculation for health reasons is COMPLETELY ABSURD.
Attached below is the complete Excel file from today’s exercise. You can feel free to adjust the URF column via the dropdown that is present in the first row of that column to see how the numbers look with different URFs.
Thank you Wayne! I found your site on my own months ago, but WelcomeTheEagle88 vouched for you and your work. I am so frustrated with this whole VAERS thing for 2 main reasons: 1. The data is FLAWED, backlogged, and UNDER-reported (obviously). And 2. I am not statistician, I cannot look at massive collections of data and see patterns (unless they are glaringly obvious) and I am way better at looking at anecdotal, individual or even simple concise information, over time, to see patterns in data. The reason for my long-winded comment is to ask ANYONE out there if there is a way to visualize all of this data, and compile it all in one place? It seems to me we need a working site that updates frequently, and is easy to use. I am not privy to the workings of websites, hosting, or even how data sets are designed- I am a simpleton. We need graphics and videos, like children, to see the big picture. You do an amazing job of this on your site, I just wish we could get a large view of everything related to the Covid shots/ “Covid Deaths” data… Is it a pipe dream? Am I asking too much to be done on this scale? Thanks again for ALL that you do!!!
You are not going to get an un-flawed site when you have physicians not reporting as they are instructed. The data that we see here is probably less than 50% of the true data. Some physicians offices have been video taped stating that they do not report vaccine incidents, despite it being mandatory. Despite this flaw in reporting, we can see that the side effects and adverse reactions are off the charts. This “vaccine” should not be injected into anyone. smallpox vaccine, if I remember, had 25 deaths and they halted the study. We are past that in the 10,000%. This is a travesty. This is corruption at it’s finest. This is a Mission Impossible movie come to life. Covid-19 is the Chimera virus. Everyone needs to wake up.
Thank you for this work.
I briefly reviewed above. I’m unsure if we can we get an apples to apples comparison of serious adverse effects (or hospitalizations) from covid-19 jab vs covid-19 disease from this data? I think this would be more enlightening as I feel most adults (vaxxed or unvaxxed) and main stream media agree risk of death from covid-19 disease for kids is minuscule.