Disclaimer: This post in NO way, shape, or form constitutes financial advice whatsoever. Consult with your own financial advisor (or do your own due diligence) before making any trading or investment decisions, especially ones predicated on information from anonymous people on the internet…markets can be hazardous to your wealth.
It is this author’s conclusion that a gross level of fraud and malfeasance has occurred on the part of the Covid-19 inoculation manufacturers, carried out in conjunction with regulators who have turned a blind eye to safety, and assisted by a mainstream media which has marketed these products with no transparency about risks of harm. This fraud is reflected in the clinical trial data, the ongoing cover-up and throttling of adverse event data in both public (VAERS) and private (DMED, CMS, etc.) adverse event systems, and the utter and complete refusal by public health authorities, governments, and the MSM to acknowledge more than a handful of deaths related to the shots. In this author’s opinion, it is only a matter of time before the fraud is fully exposed and openly acknowledged for all to see. To name a few examples of fraud:
- The proclamation of the efficacy of the shots against death when the Pfizer clinical trial clearly showed greater all-cause mortality in the treatment arm vs. the placebo arm,
- The unacknowledged injuries of people in the clinical trials such as Maddie De Garay and Brianne Dressen, which were either minimized or completely erased from the clinical trial results,
- The Pfizer clinical trial violations at Ventavia brought forth by whistleblower Brooke Jackson (who has filed a $2B lawsuit),
- The failure by Moderna to report 300K adverse events in a timely manner to VAERS as they were required to do,
- The removal of adverse event data from VAERS prior to ever publishing it publicly.
- There is likely much, much more to come as independent analysts wade through the Pfizer documents (used as basis for FDA approval of their jab for the 16+ crowd) that a judge recently ordered the FDA to produce for public view at a pace of 55,000 pages per month instead of the 500 pages per month that was originally requested by the FDA.
The financial markets are often referred to as a “forward-looking mechanism” or “discounting mechanism”. In other words, the prices of publicly traded companies are based on projected future returns on their assets (think future sales revenue, cash flow, etc.). Financial markets will often be the first place to reflect that there are serious underlying problems with the future prospects of a business or asset. Have the financial markets been flashing any warning signs indicating that there is something amiss with the future business prospects of the four companies manufacturing and profiting from the Covid-19 inoculations in the U.S. (Pfizer, Biontech, Moderna, Johnson & Johnson)? Are there cracks in the armor of these companies? While all of these stocks have had significant runs up from the pandemic lows of March 2020 (PFE 35% run up, MRNA 2517% run up, JNJ 65% run up, BNTX 1490% run up), Moderna and Biontech are now down about 73% and 71% respectively, from their previous highs. Pfizer and JNJ are down about 23% and 9% from their respective highs. The figures for Moderna and Biontech certainly make sense given that they are one-product wonders, and their fortunes will rise and fall directly in response to the perceived future revenue prospects of the Covid-19 shots, whereas Pfizer and JNJ are more mature companies with established and extensive product pipelines and do not rely exclusively on the Covid-19 injections for their revenue.
However, if and when the extensive fraud is shown, proven, and openly acknowledged, the liability shield that the manufacturers enjoy can and will be pierced, and the manufacturers may be held liable for the damages these inoculations have caused. Once fraud is proven and the liability shield is invalidated, the Covid-19 shots may be recalled or halted, and a flood of lawsuits may ensue. Whether or not these lawsuits end up having any actual success in extracting monetary damages from these corporations, one thing that is certain in this scenario is that these stocks will come under tremendous sell pressure. Even the simple acknowledgment of fraud by the MSM is likely enough to begin a downward spiral (or exacerbate an ongoing one) in the stock prices of these companies.
[As a side note, there are also other clues already present in the financial markets portending hard times for these stocks (and possibly the pharmaceutical industry as a whole?). We see that many insurance companies are now seeing astronomical increases in mortality/morbidity (see Indiana Life insurance deaths up by unprecedented 40%, German Public Health Insurer reports adverse events higher by 8-10x, Insurance Company Death Claims up 20%+, and Swiss RE 4 billion in losses), and some are also now trying to offload risk onto others before anyone notices, while at the same time, the stocks of public funeral homes (such as SCI and CSV) handily beat the S&P 500 market average in 2021 (up 40%+ vs. 26%), which is atypical.]
The rest of this post will focus on technical analysis of the chart patterns for the aforementioned stocks (If none of that interests you, please do at least watch the two videos at the bottom of the post). To begin with, while there are countless methodologies used to interpret the price action in financial markets, this author is very familiar with and prefers utilizing the Volume Profiling (or volume at price) method of interpreting price action, and therefore the rest of this post will interpret the price action through this lens. As a quick primer, Volume Profiling (and its related predecessor Market Profiling) interprets price action primarily as an auction between buyers and sellers and tracks the level of volume traded at each price to determine important price levels and inflection points. Areas where high trading volume occur represent areas of price consensus between buyers and sellers, and are called “High Volume Nodes” (HVNs), whereas areas of low trading volume represent areas where price quickly moved away as a result of non-consensus between buyers and sellers during the auction process, and are called “Low Volume Nodes” (LVNs). The highest volume area on any given chart is deemed the “Volume Point of Control” (VPOC), which represents the “fairest price” to do business. Areas of high volume, especially the VPOC, tend to act as magnets, attracting price towards them, since they are areas where a high volume of trading was previously conducted and there was greater “price agreement” between buyers and sellers. Areas of low volume tend to act as reversal points or acceleration points and do not tend to slow the movement of price. These areas generally indicate the market is conducting price exploration and seeking a “fair price”. Also, as a general principle, markets tend to alternate between cycles of balance and imbalance (or phrased another way, compression and expansion), whereby markets will spend some time in a defined trading range during a balancing phase when there is relative price consensus, and then subsequently break out of these areas to move directionally (price exploration up or down) during an imbalanced phase as the market seeks a new “fair price” to do business.
The chart for Moderna (symbol: MRNA), which is currently down about 73% from its highs, is shown below. In 2021, Moderna generated a net income of $12.2 billion on revenues of $18.5 billion.
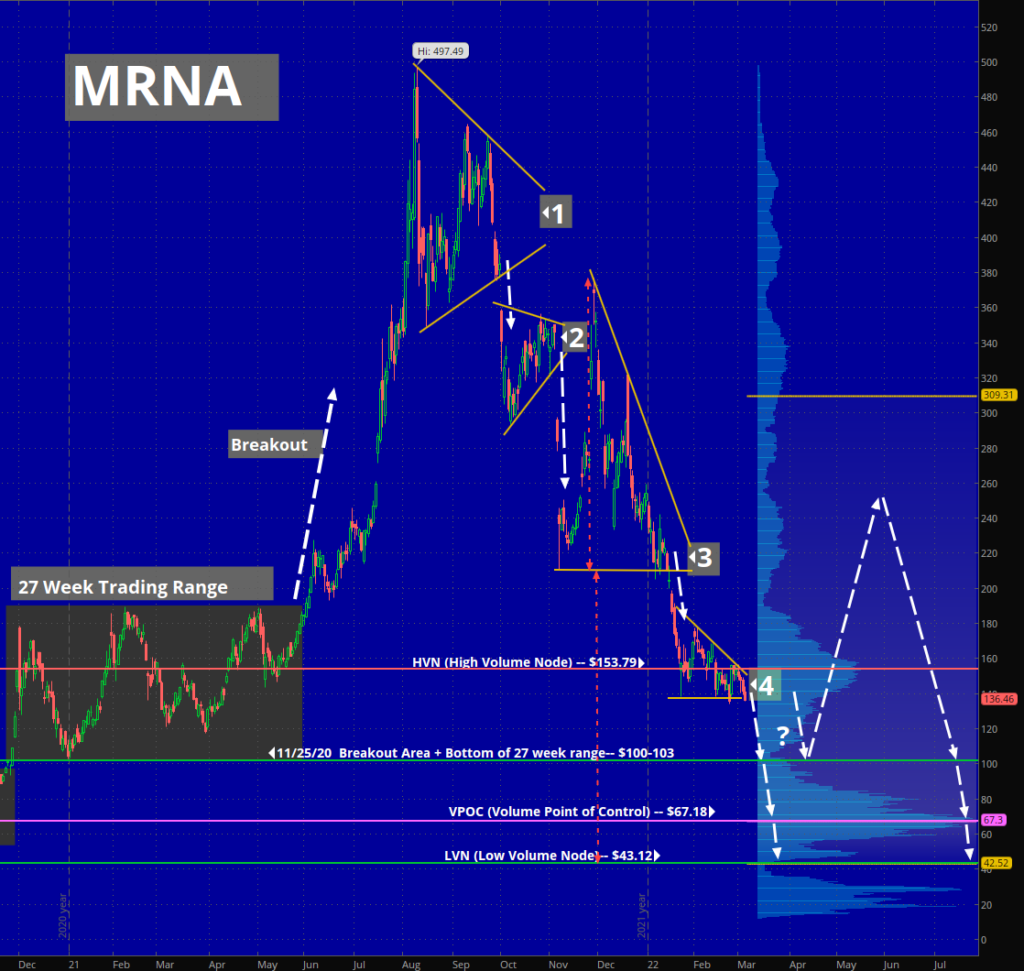
There is some serious weakness going on in this stock. The fact that MRNA is already down 73% from its highs, whilst there has been as of yet, no mainstream public acknowledgment of fraud should be a concern for anyone with a long position in this stock. Higher than normal insider selling recently should also be a concern. While the previous breakout to the upside from a 27 week trading range (11/25/20-6/2/21) was strong and resulted in MRNA more than doubling in price, the hyperbolic move up has now completely retraced and the breakout has essentially failed. The initial confirmation of the change in the trend (from up to down) started on Oct. 1st of last year, when price broke down sharply out of an 8 week pennant pattern (see triangular area labelled 1). Since then, it has formed two more triangular consolidation areas which have also broken down (areas labeled 2 and 3). We are now in a 4th triangular consolidation area (a descending triangle), where prices have spent some time balancing and compressing around the HVN at $153.79. At this point in time, the price action seems to be portending another break to the downside. On any such break, the targets (and support areas) to the downside include:
- The $100-103 area, which is the 11/25/20 breakout area and the bottom of the 27 week trading range (rectangle highlighted in gray) and a Low Volume Node (LVN). Given how oversold this stock has gotten, with 3 previous strong pushes to the downside already, it would not be unreasonable to expect a sharp reaction and a short-covering rally upon hitting this area. Any such bounce from the $100-103 area could reasonably run as high as $250-253 (corresponding to a typical 38.2% fibonacci retracement of the complete downside move) and still leave the downtrend completely intact. Note however, that often a very weak market may not even be able to bounce that high.
- The $67 area is the Volume Point of Control (VPOC), which is where the greatest volume of trading has taken place and is therefore the area where the greatest price consensus has occurred for this stock. Once price is trading back in the vicinity of this VPOC, it will likely be drawn back towards the VPOC like a magnet. So, the expectation is that any sustained break below the $100-103 area will open up the path to visiting the $67 level, where it will likely be “stuck” for a while.
- the $43 level is a Low Volume Node. Upon continued weakness that causes prices to explore lower from the $67 VPOC, the expectation is for prices to test this LVN area. The fact that this area also coincides with the 100% downside extension target of the breakdown from the 3rd triangle (see dashed red lines), makes it an even better target. This area could certainly serve as the launch point of a counter-trend bounce as well.
- Further targets to the downside below (not pictured) include $27.8 (HVN), $18-19 (HVN), and the all-time low of $11.54.
- Given that Moderna is a one product company, if the Pharma fraud is eventually openly acknowledged, widely known, and subsequently priced into the financial markets, the prospect of this stock going to zero is well within the realm of possibility, especially if lawsuits gain traction and billion dollar settlements are suddenly on the horizon.
The chart for BionTech (symbol: BNTX) is practically a twin image of Moderna’s. BNTX is currently down 71% off of its high at $464 and is shown below. As with Moderna, any long positions in this stock should be concerning given how far it has already fallen, since there have not yet been any publicly widespread allegations of fraud at this point.
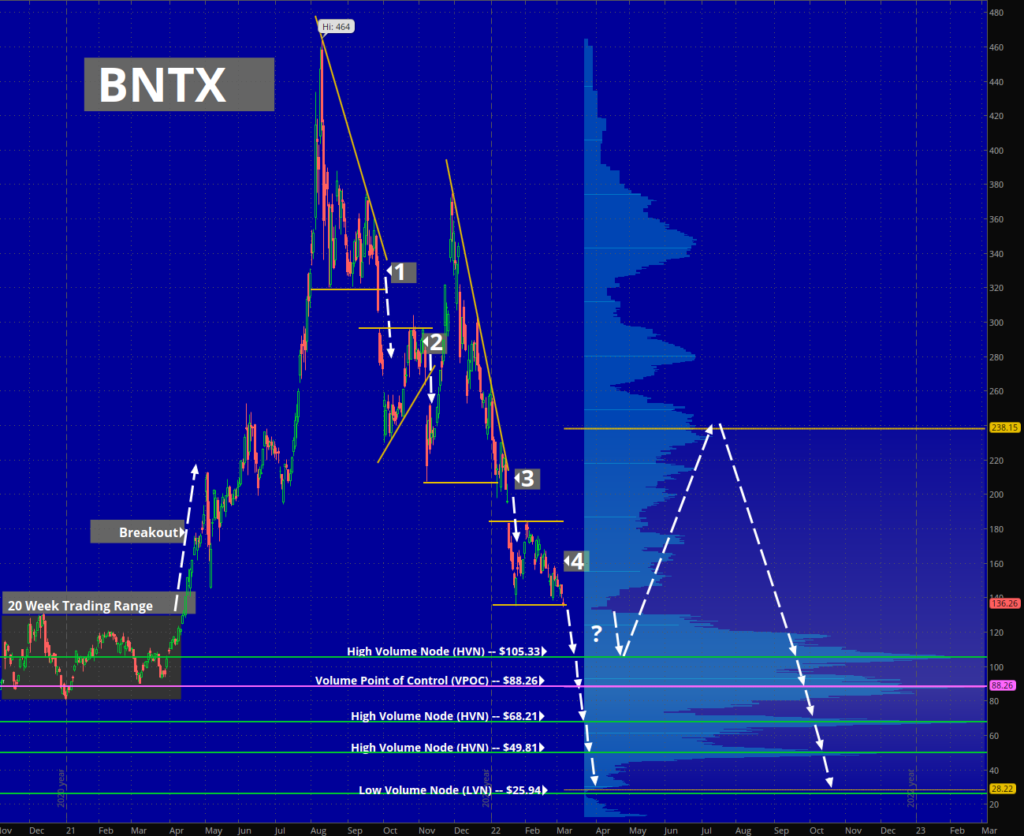
It has essentially followed the same pattern as Moderna– a hyperbolic move up followed by three large pushes down (labelled 1-3). We are now in a 4th consolidation area, right near the original breakout area of the 20 week trading range (between 11/9/20-4/13/21). Similar to MRNA, this 4th consolidation area looks like it has just begun to breakdown, so here are the notable targets to the downside:
- The $105 area is a major High Volume Node (HVN), and is the first target and level of support below. As with Moderna, given the overall large move downwards already, another push down from the 4th consolidation area can easily produce a significant counter-trend rally. Any such rally which bounces from this $105 area and produces a typical 38.2% retracement of the entire down move can be projected to hit the $240-243 area, after which a resumption of the downside can be expected. This area also happens to be the top of a large 33-week long trading range between 3/16/20-11/6/20 (not pictured), so it is expected to act as good support the first time price comes down to it.
- The $88 area is the Volume Point of Control (VPOC), so if price breaks below the $105 area, expect this area to be the magnetic target.
- The $67 area is a High Volume Node (HVN). Expect that to be support if price escapes and explores below the VPOC.
- The $49-50 area is another High Volume Node (HVN) and good target if price explores further to the downside.
- The next area below is the $26 area, which is a Low Volume Node (LVN). The expectation is that if price touches this area, another counter-trend rally is likely to ensue.
- As with Moderna, if BionTech is subject to litigation and liability, this stock could realistically hit $0.
Now, let’s look at Pfizer (PFE), which is shown below. 45% of Pfizer’s revenue in 2021 was attributed to sales of its Covid-19 jab. So Pfizer’s business could be significantly impacted by any adversity in the revenue stream of this product. Note that Pfizer recently reported strong Q4 earnings on 2/8, yet the market responded by gapping down the stock. While selling in stocks after earnings releases is not an unusual thing, the downtrend has since continued to this day. Also note that there were some curious changes to Pfizer’s risk disclosures from Q3 to Q4, as explained in greater detail here. On the chart below, from a larger timeframe perspective, Pfizer has not yet broken down in any significant way, and though it is down about 21% from the highs, it is technically still in an uptrend.

It is very possible, however, that it may be in the process of forming a “Head and Shoulders” pattern (H&S), which is a fairly bearish pattern. You can see this pattern outlined in the chart above with the left shoulder located at the high of $51.86 marked by a gold oval, and the head located at the high of $61.71 also marked by a gold oval. The right shoulder has yet to form, but is projected to form at the 3rd gold oval. The neckline of this pattern is at the $40.94 level. From where it is now, if this H&S pattern actually does play out, then the right shoulder would be completed after a drop back down to near the neckline, followed by a bounce back up to the $50-$52 area. If the pattern forms and is valid, a subsequent breakdown beneath the neckline would flip the trend bearish, and the potential completion target below would be $20.17, representing the 100% extension of the height of H&S pattern. Here are the major price targets below:
- The $32 area is a High Volume Node (HVN) and the first major downside target. This may be an area from which to expect a possible counter-trend rally to the upside. A bounce from this area could result in a retest of the H&S pattern neckline around $41 or even higher to the $44 area (representing a 38.2% retracement of the whole move down from the $61.71 high). However, any such bounce which stalls out in this area could roll-over, fail, and send the price back down.
- $26.43 represents the low made in March of 2020 during the pandemic. If there was no significant bounce at the $32 area, a move down which retests this $26.43 low is likely to find buyers on the first time down and produce a short-term but sizable bounce to the upside. Any such bounce which remains below the $40 area will likely also roll-over, fail, and send the price back down.
- The $20.17 area is the 100% completion target for the bearish H&S pattern (see the dashed red lines), and a high probability target if the market experience sustained weakness below $26.43.
- $16.40 area is the Volume Point of Control (VPOC) and the last major target on the downside. If price begins trading below $20.17, the expectation would be an eventual move to the VPOC, at which point the price may very well start balancing in a trading range around that level.
- Below that, the most notable target would be the $11.02 low, which is the low established in March of 2009, as the market was bottoming out from the 2008 financial crisis (the previous major FRAUD event of our time–related to sub-prime mortgages). Hitting this area would be very likely to produce a counter-trend rally, and perhaps a sizable one.
Will we eventually get all the way down to $11.02 (and even in the sub-$10 range)? If the fraud comes out in the open and the vast number of lies are exposed, and if this leads to Wall Street bailing on big Pharma, and especially if there are billion dollar injury settlements or even criminal prosecutions, the answer would be YES. If things get bad enough for PFE, could this massive multi-billion dollar stalwart of a Pharma company even go the way of Enron (ie. out of business)? Is it possible? YES. Is it likely? Who knows?
Lastly, let’s take a look at JNJ’s chart. Like Pfizer, JNJ has not yet broken down in any significant way, and is only about 6% off of it’s all-time high, making it the strongest of the 4 stocks. Given that JNJ is a broadly diversified company with segments in the Consumer Health and Medical Device sectors in addition to Pharmaceuticals, it should not come as a big surprise that their recent foray into the vaccine market does not comprise a large part of its business. For 2021, JNJ had $2.4 billion in sales of its Janssen Covid-19 jab, but this amount only represents 4.6% of its Pharmaceutical sales (note that JNJ’s pharmaceuticals business comprises 76% of its income, and comprises 56% of its total sales revenue). Furthermore, JNJ has the smallest market share of the three Covid-19 inoculations being used in the U.S.
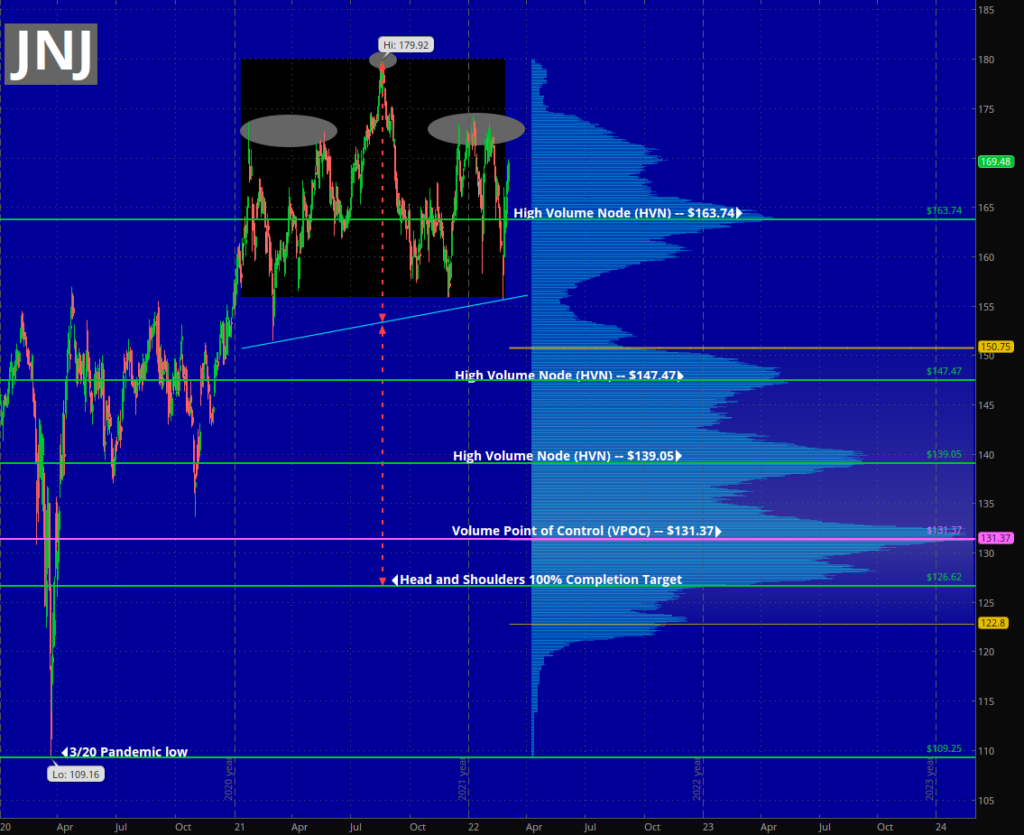
As strong as the JNJ chart looks at this point, notice that similar to PFE, it has also formed a fairly mature “Head and Shoulders” pattern (H&S), though not a very clean one. In contrast to PFE, though, in JNJ’s case, the H&S pattern is already complete — the left and right shoulders and the head have all formed and are marked above using gray ovals. Any strong and sustained break below the neckline (the upward sloping blue line currently at the $156 area) would change the trend and send prices lower. If the H&S pattern actually does play out to the downside, the completion target is at $126.62, representing the 100% extension of the height of H&S pattern. Here are the major price targets below:
- The $147 area is a High Volume Node (HVN) and the first major downside target. This area is also the top of a trading range between $120-$148 established for almost 3 years between 2017 and 2019 (not pictured). However, since this area is not a great distance below the bottom of the current trading range (highlighted in black rectangle) around $156, the expectation is not for any significant bounce from this $147 area.
- The $139 area is bigger High Volume Node (HVN) and represents the next target below. If there has been no counter-trend rally previously, expect a potential bounce from this area which could retest the $156 area.
- The $131 area is the Volume Point of Control (VPOC) and a major downside target on further weakness below $139.
- $126.62 is the downside completion target for the H&S pattern. A counter-trend short-term rally is likely from this area.
- Below that, the most notable target would be the $109.25 low, which is where the market bottomed out in March of 2020 during the pandemic. Hitting this area would require significant continued weakness in this stock.
- Further targets below would likely require an absolute market liquidation panic, but would include the following: $100 area (HVN), $81.79 (2015 year’s low), $65 (major VPOC over a 32 year timeframe).
Out of the four stocks, JNJ is the most uncertain as far as anticipating a large move to the downside. Given that JNJ is not primarily a vaccine manufacturer and has neither put all its “eggs in one basket”, nor does it have that much “skin in the game”, it seems questionable whether the revelation of fraud by itself can really send this stock into sub-$50 territory. However, a recall of the Covid-19 shots, along with billion dollar liability settlements against these manufacturers, and prison time for high level employees, could certainly help in that regard.
One last point that should be addressed is regarding the timing for any one of the hypothetical scenarios mentioned above: When might we expect these things to play out? Timing is always one of the greatest challenges in the markets, but since the basis for a projected future sell-off in these four stocks is the revelation of fraud and malfeasance on the part of the Covid-19 jab manufacturers, this is especially true in this case. The timing of the anticipated sell-off will obviously be highly dependent on the timing of the revelation of fraud. At this point it is anyone’s guess when a flash point might occur which triggers the initial drop which can then snowball into a downward cascade. What we do know is that more and more damning information is coming out each day, and at some point, we will reach a critical mass of people in the general populace awakening to the fraud. It may behoove the speculator to implement strategies which mitigate risk due to great uncertainty about the timing in this instance. That being said, this author is predicting a recall or halt to the Covid-19 jabs in 2022.
One very last thing to keep in mind also is that the old adage “Bulls climb the stairs to go up, but Bears jump out the window to go down” may apply, so being too late to the Bear party may make it difficult to get on board, as moves to the downside dominated by fear and panic, once they begin, tend to play out in relatively quick fashion.
Disclosure: Author has bearish positions in PFE and MRNA. The author’s opinions are solely his own. Author receives neither any compensation for these opinions nor has any business relationship with any company whose stock is mentioned in this article or any company that provides financial advice or investment services.
Lastly, some food for thought…moral justification for seeking the demise of the aforementioned companies:
What’s that you say, Mr. Dowd? Red Stocks to wake up the public? And Moderna is $0-bound and Pfizer going sub-$10?